Define a trajectory dataset given its milestone network and milestone percentages or progressions
R/wrap_add_trajectory.R
add_trajectory.RdDefine a trajectory dataset given its milestone network and milestone percentages or progressions
add_trajectory(dataset, milestone_ids = NULL, milestone_network,
  divergence_regions = NULL, milestone_percentages = NULL,
  progressions = NULL, allow_self_loops = FALSE, ...)

is_wrapper_with_trajectory(trajectory)
Arguments
| dataset | A dataset created by |
|---|---|
| milestone_ids | The ids of the milestones in the trajectory. Type: Character vector. |
| milestone_network | The network of the milestones. Type: Data frame(from = character, to = character, length = numeric, directed = logical). |
| divergence_regions | A data frame specifying the divergence regions between milestones (e.g. a bifurcation). Type: Data frame(divergence_id = character, milestone_id = character, is_start = logical). |
| milestone_percentages | A data frame specifying what percentage milestone each cell consists of. Type: Data frame(cell_id = character, milestone_id = character, percentage = numeric). |
| progressions | Specifies the progression of a cell along a transition in the milestone_network. Type: Data frame(cell_id = character, from = character, to = character, percentage = numeric). |
| allow_self_loops | Whether to allow self loops Type: Logical |
| ... | extra information to be stored in the dataset |
| trajectory | The trajectory as created by |
Value
The trajectory
Examples
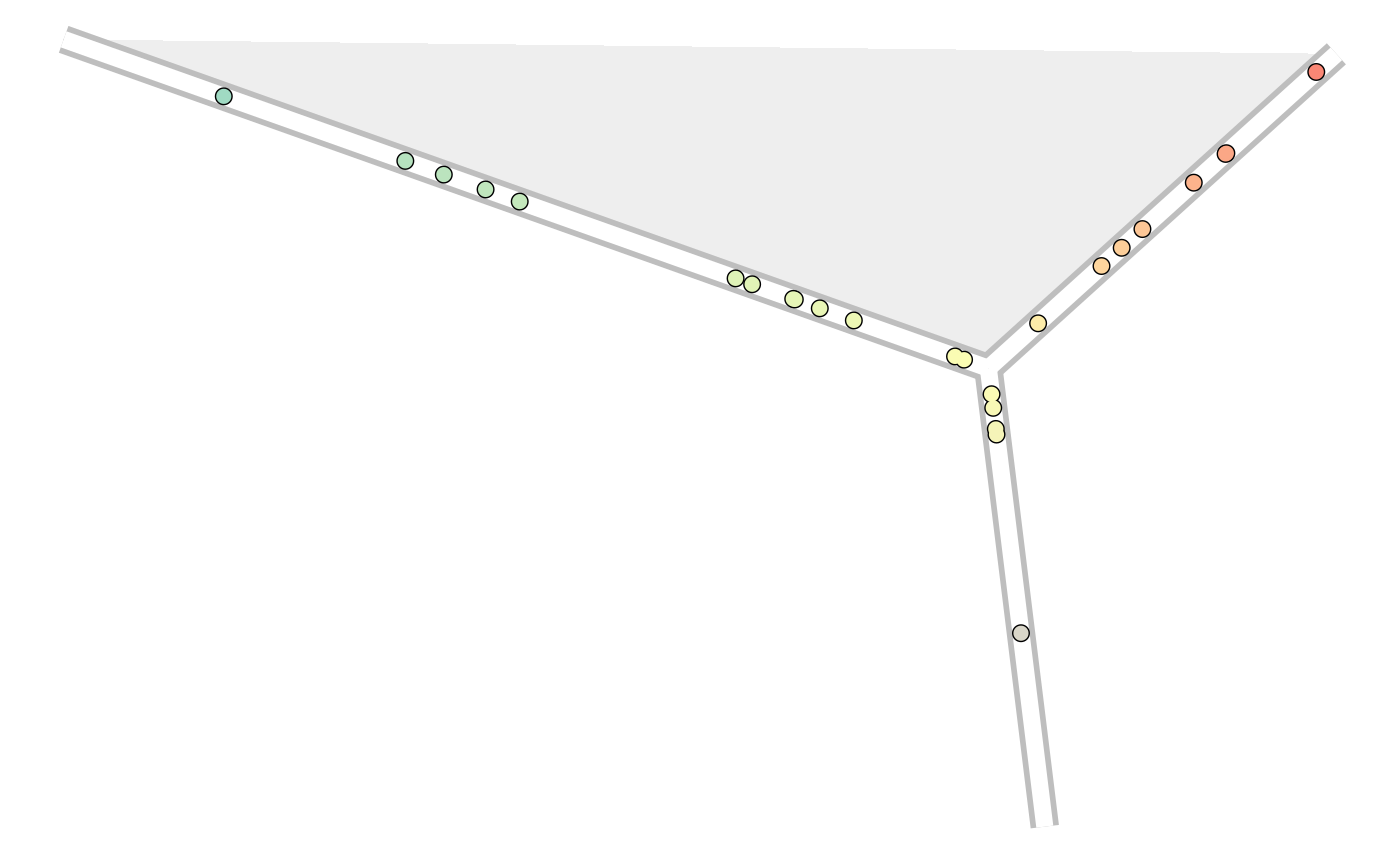
library(dplyr) library(tibble) dataset <- wrap_data(cell_ids = letters) milestone_network <- tribble( ~from, ~to, ~length, ~directed, "A", "B", 1, FALSE, "B", "C", 2, FALSE, "B", "D", 1, FALSE, ) milestone_network#> # A tibble: 3 x 4 #> from to length directed #> <chr> <chr> <dbl> <lgl> #> 1 A B 1 FALSE #> 2 B C 2 FALSE #> 3 B D 1 FALSEprogressions <- milestone_network %>% sample_n(length(dataset$cell_ids), replace = TRUE, weight = length) %>% mutate( cell_id = dataset$cell_ids, percentage = runif(n()) ) %>% select(cell_id, from, to, percentage) progressions#> # A tibble: 26 x 4 #> cell_id from to percentage #> <chr> <chr> <chr> <dbl> #> 1 a B D 0.578 #> 2 b A B 0.675 #> 3 c A B 0.857 #> 4 d B C 0.182 #> 5 e B D 0.0863 #> 6 f B C 0.0263 #> 7 g A B 0.410 #> 8 h A B 0.318 #> 9 i B C 0.145 #> 10 j A B 0.557 #> # … with 16 more rowsdivergence_regions <- tribble( ~divergence_id, ~milestone_id, ~is_start, "1", "A", TRUE, "1", "B", FALSE, "1", "C", FALSE ) divergence_regions#> # A tibble: 3 x 3 #> divergence_id milestone_id is_start #> <chr> <chr> <lgl> #> 1 1 A TRUE #> 2 1 B FALSE #> 3 1 C FALSEtrajectory <- add_trajectory( dataset, milestone_network = milestone_network, divergence_regions = divergence_regions, progressions = progressions ) # for plotting the result, install dynplot dynplot::plot_graph(trajectory)#> Coloring by milestone#> Using milestone_percentages from trajectory