Creating a trajectory
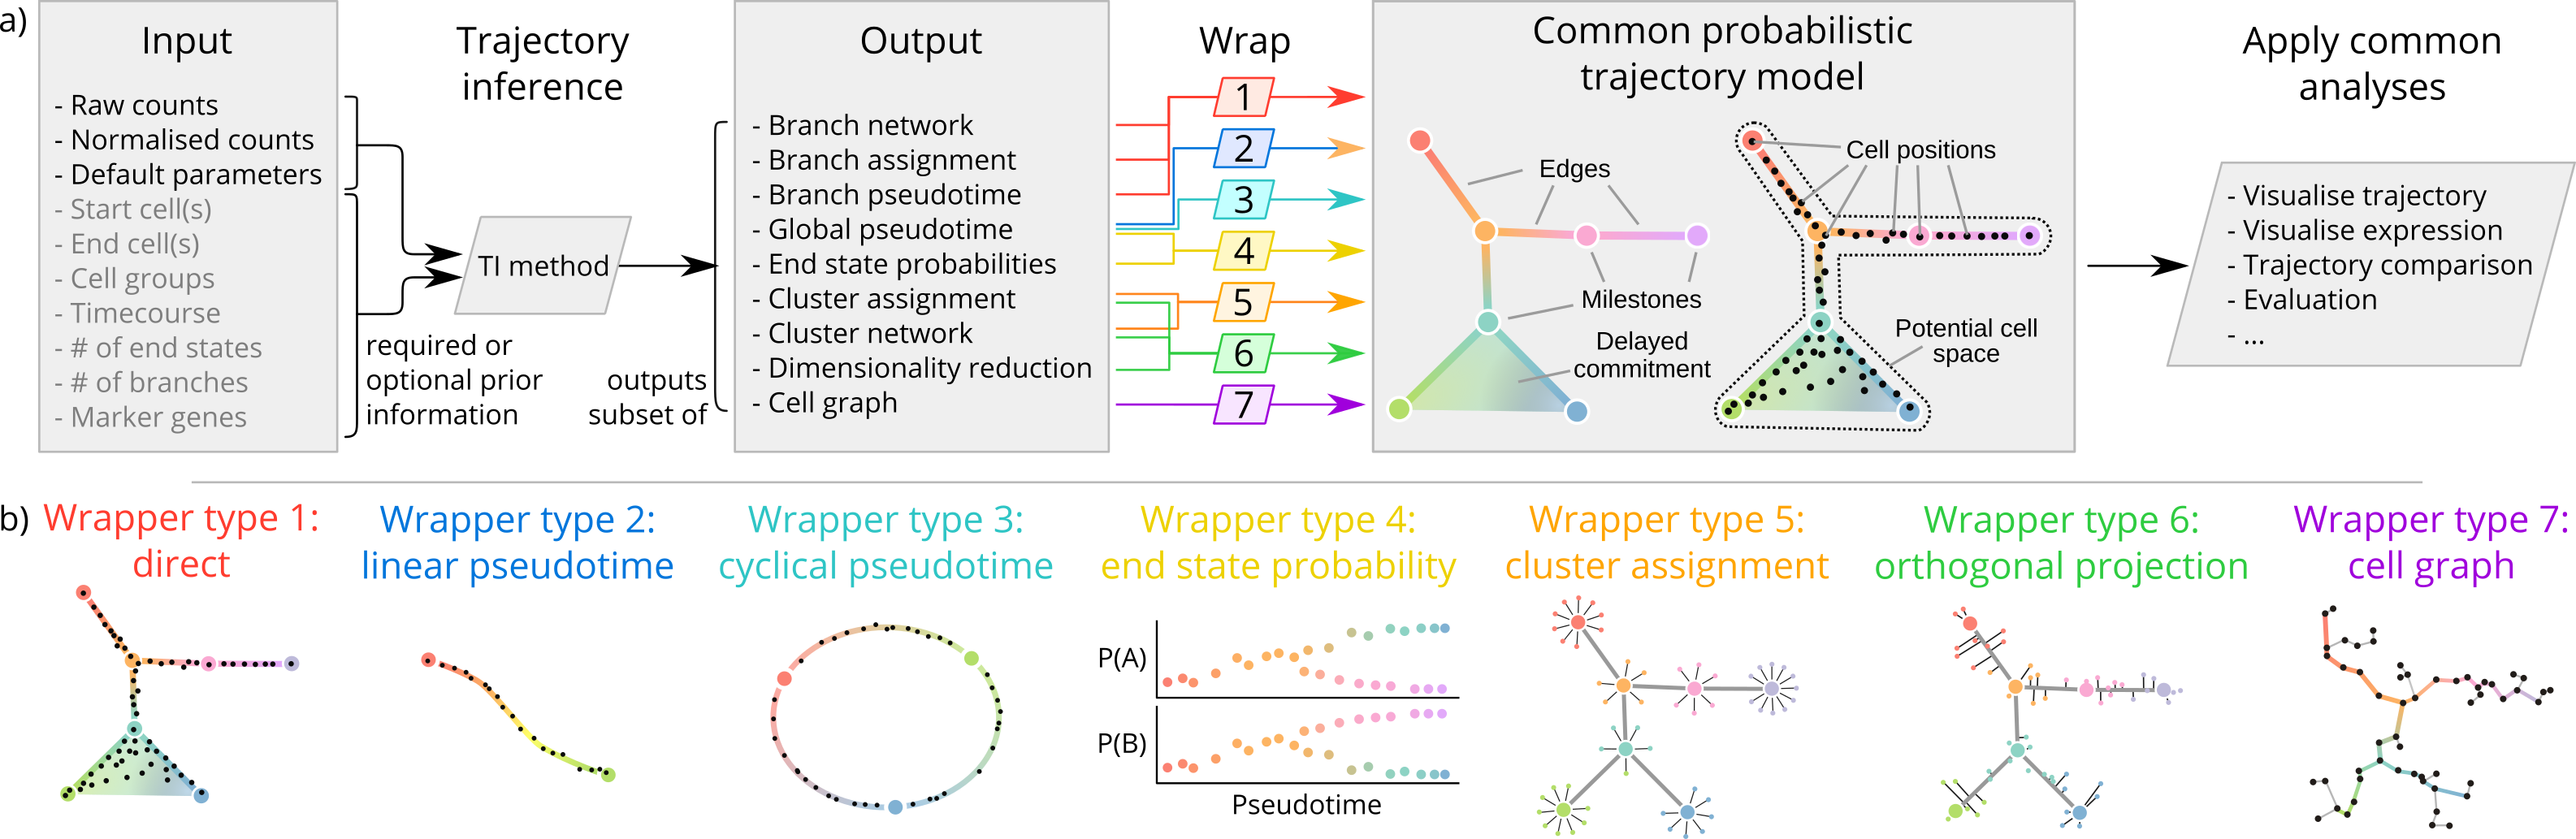
Common trajectory model
dynwrap always represents trajectories in the same way, as illustrated here with a tree trajectory
- Milestone network, contains information of connections between milestones
## # A tibble: 5 x 4
##   from        to          length directed
##   <chr>       <chr>        <dbl> <lgl>
## 1 Milestone_A Milestone_B    1   FALSE
## 2 Milestone_B Milestone_C    2   FALSE
## 3 Milestone_B Milestone_D    1   FALSE
## 4 Milestone_C Milestone_E    1   FALSE
## 5 Milestone_C Milestone_F 1.5 FALSE- Milestone percentages, contains how close a cell is to a milestone. For each cell, the percentages sum to one.
## # A tibble: 10 x 3
##    cell_id milestone_id percentage
##    <chr>   <chr>             <dbl>
##  1 Cell_a  Milestone_B       0.528
##  2 Cell_a  Milestone_D       0.472
##  3 Cell_b  Milestone_B       0.794
##  4 Cell_b  Milestone_C       0.206
##  5 Cell_c  Milestone_C       0.120
##  6 Cell_c  Milestone_E       0.880
##  7 Cell_d  Milestone_B       0.232
##  8 Cell_d  Milestone_D       0.768
##  9 Cell_e  Milestone_A       0.862
## 10 Cell_e Milestone_B 0.138- Progressions, an alternative to milestone percentages, also contains the positions of each cell but now based on its progression through an edge
## # A tibble: 10 x 4
##    cell_id from        to          percentage
##    <chr>   <chr>       <chr>            <dbl>
##  1 Cell_a  Milestone_B Milestone_D      0.472
##  2 Cell_b  Milestone_B Milestone_C      0.206
##  3 Cell_c  Milestone_C Milestone_E      0.880
##  4 Cell_d  Milestone_B Milestone_D      0.768
##  5 Cell_e  Milestone_A Milestone_B      0.138
##  6 Cell_f  Milestone_B Milestone_C      0.419
##  7 Cell_g  Milestone_A Milestone_B      0.544
##  8 Cell_h  Milestone_B Milestone_D      0.145
##  9 Cell_i  Milestone_B Milestone_C      0.304
## 10 Cell_j Milestone_C Milestone_F 0.266- Divergence regions, contain the information on >=3 milestones connected to eachother. This is optional.
## # A tibble: 3 x 3
##   divergence_id milestone_id is_start
##   <chr>         <chr>        <lgl>
## 1 Divergence_1  Milestone_B  TRUE
## 2 Divergence_1  Milestone_C  FALSE
## 3 Divergence_1  Milestone_D  FALSE
Direct wrapping
These three objects (with either milestone percentages or progressions) are enough to form a trajectory using add_trajectory.
trajectory <- wrap_data(cell_ids = cell_ids) %>%
  add_trajectory(
    milestone_network = milestone_network,
    milestone_percentages = milestone_percentages,
    divergence_regions = divergence_regions
  )
Indirect wrapping
Often, you don’t want to directly output the milestone network and percentages, but want to output an alternative representation that is converted by dynwrap to the common representation:
Check out the reference documentation for an overview and examples of the different wrappers