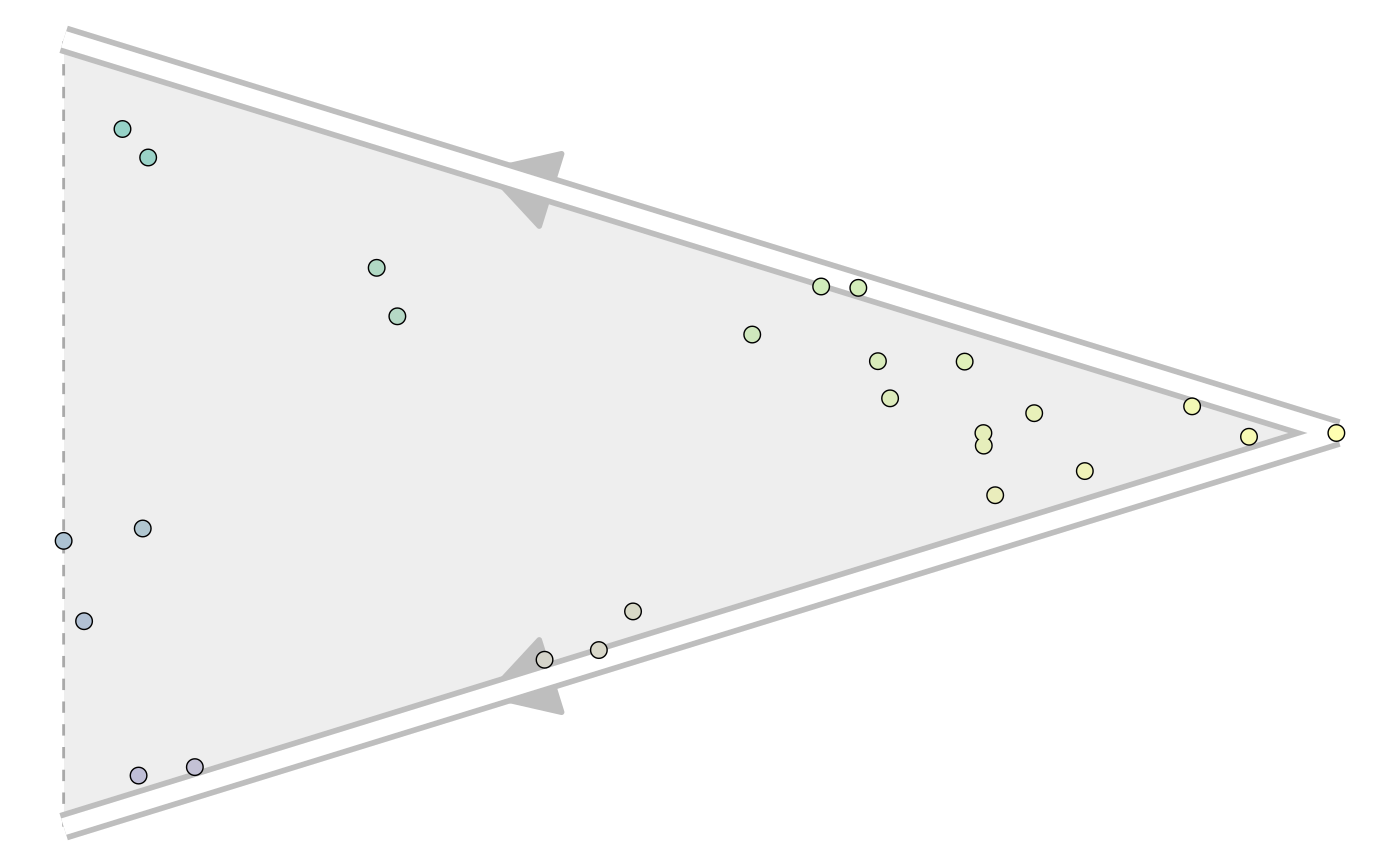
Multifurcating trajectory with end state probabilities
R/wrap_add_end_state_probabilities.R
add_end_state_probabilities.RdConstructs a multifurcating trajectory using the pseudotime values of each cell and their end state probabilities. If pseudotime values are not given, will use pseudotime already present in the dataset.
add_end_state_probabilities(dataset, end_state_probabilities,
  pseudotime = NULL, do_scale_minmax = TRUE, ...)
Arguments
| dataset | A dataset created by |
|---|---|
| end_state_probabilities | A dataframe containing cell_id (character) and additional numeric columns containing the probability for every end milestone. If the data_frame contains only a cell_id column, the data will be processed using |
| pseudotime | A named vector of pseudo times. |
| do_scale_minmax | Whether or not to scale the pseudotime between 0 and 1. Otherwise, will assume the values are already within that range. |
| ... | Extras to be added to the trajectory |
Value
The trajectory
Details
This function will generate the milestone_network and progressions.
Examples
library(tibble) dataset <- wrap_data(cell_ids = letters) pseudotime <- runif(length(dataset$cell_ids)) names(pseudotime) <- dataset$cell_ids pseudotime#> a b c d e f g h i j k #> 0.26208100 0.31291465 0.90985206 0.29921090 0.37633529 0.10503234 0.29894843 0.58034821 0.91686555 0.87572983 0.36744064 #> l m n o p q r s t u v #> 0.29059605 0.41783442 0.91381484 0.55536681 0.39066318 0.22506533 0.46822548 0.95670465 0.14662831 0.72767226 0.92862377 #> w x y z #> 0.62005017 0.04116467 0.74278406 0.97165338end_state_probabilities <- tibble( cell_id = dataset$cell_ids, A = runif(length(dataset$cell_ids)), B = 1-A ) end_state_probabilities#> # A tibble: 26 x 3 #> cell_id A B #> <chr> <dbl> <dbl> #> 1 a 0.606 0.394 #> 2 b 0.810 0.190 #> 3 c 0.875 0.125 #> 4 d 0.500 0.500 #> 5 e 0.753 0.247 #> 6 f 0.430 0.570 #> 7 g 0.442 0.558 #> 8 h 0.0242 0.976 #> 9 i 0.0376 0.962 #> 10 j 0.0268 0.973 #> # … with 16 more rowstrajectory <- add_end_state_probabilities(dataset, end_state_probabilities, pseudotime) # for plotting the result, install dynplot dynplot::plot_graph(trajectory)#> Coloring by milestone#> Using milestone_percentages from trajectory