> Reference > > dynwrap :: Creating a trajectory > Constructs a circular trajectory using the pseudotime values of each cell.
Constructs a circular trajectory using the pseudotime values of each cell.
Source:
R/wrap_add_cyclic_trajectory.R
add_cyclic_trajectory.RdThis function will generate the milestone_network and progressions.
add_cyclic_trajectory(dataset, pseudotime, directed = FALSE,
  do_scale_minmax = TRUE, ...)
Arguments
| dataset | A dataset created by |
|---|---|
| pseudotime | A named vector of pseudo times. |
| directed | Whether or not the directionality of the pseudotime is predicted. |
| do_scale_minmax | Whether or not to scale the pseudotime between 0 and 1. Otherwise, will assume the values are already within that range. |
| ... | extra information to be stored in the wrapper. |
Value
The trajectory
Examples
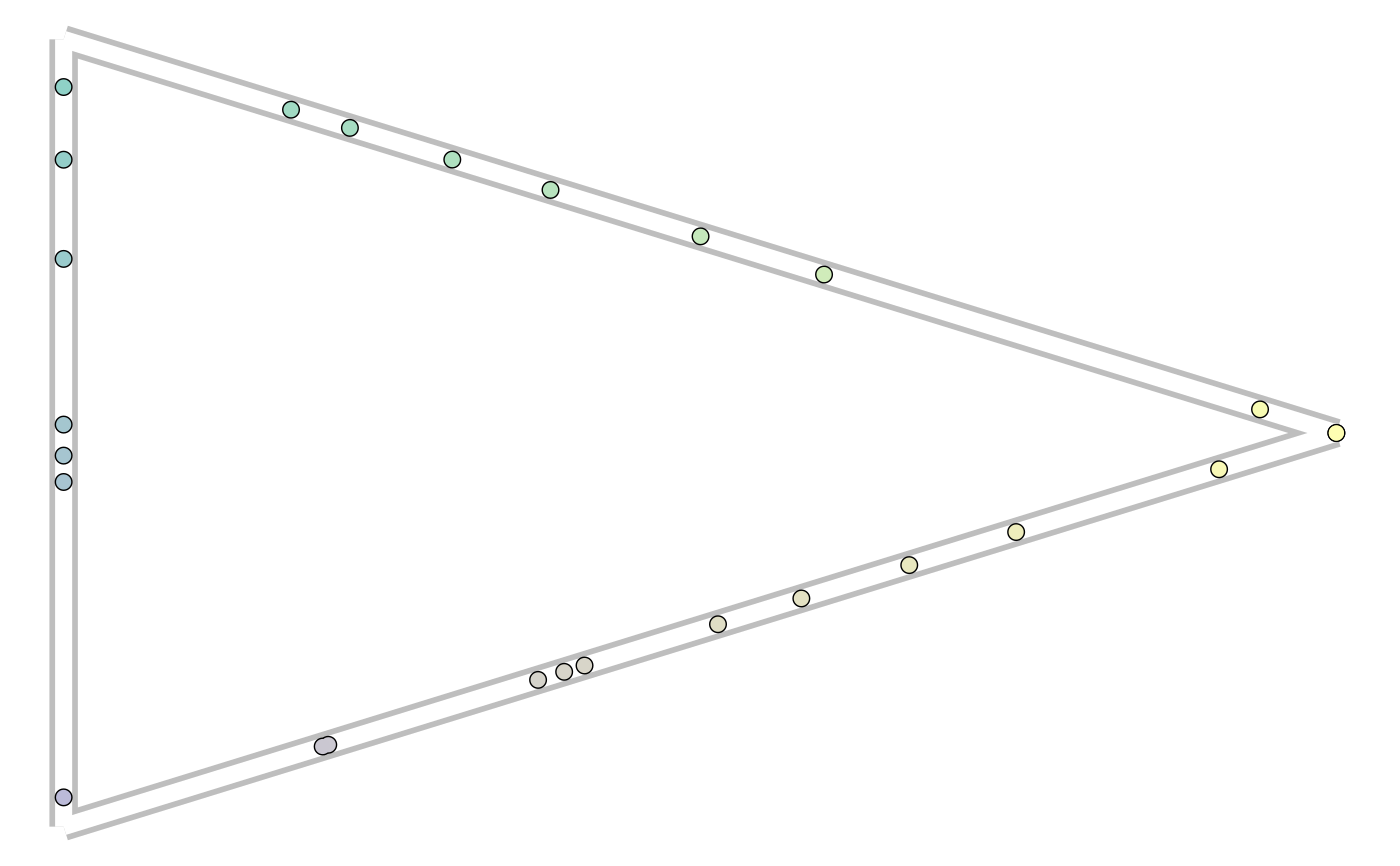
library(tibble)
dataset <- wrap_data(cell_ids = letters)

pseudotime <- tibble(cell_id = dataset$cell_ids, pseudotime = runif(length(dataset$cell_ids)))
pseudotime#> # A tibble: 26 x 2
#>    cell_id pseudotime
#>    <chr>        <dbl>
#>  1 a           0.525
#>  2 b           0.659
#>  3 c           0.734
#>  4 d           0.0529
#>  5 e           0.979
#>  6 f           0.380
#>  7 g           0.448
#>  8 h           0.785
#>  9 i           0.207
#> 10 j           0.733
#> # … with 16 more rowstrajectory <- add_cyclic_trajectory(dataset, pseudotime)

# for plotting the result, install dynplot
dynplot::plot_graph(trajectory)#> Coloring by milestone#> Using milestone_percentages from trajectory