> Reference > > dynwrap :: Creating a trajectory > Constructs a trajectory using a cell grouping and a network between groups. Will use an existing grouping if it is present in the dataset.
Constructs a trajectory using a cell grouping and a network between groups. Will use an existing grouping if it is present in the dataset.
Source:
R/wrap_add_cluster_graph.R
add_cluster_graph.RdThis function will generate the milestone_network and progressions.
add_cluster_graph(dataset, milestone_network, grouping = NULL,
  explicit_splits = FALSE, ...)
Arguments
| dataset | A dataset created by |
|---|---|
| milestone_network | A network of milestones. |
| grouping | A grouping of the cells, can be a named vector or a dataframe with group_id (character) and cell_id (character) |
| explicit_splits | Whether to make splits specific by adding a starting node. For example: A->B, A->C becomes A->X, X->B, X->C |
| ... | extra information to be stored in the wrapper. |
Value
The trajectory
Examples
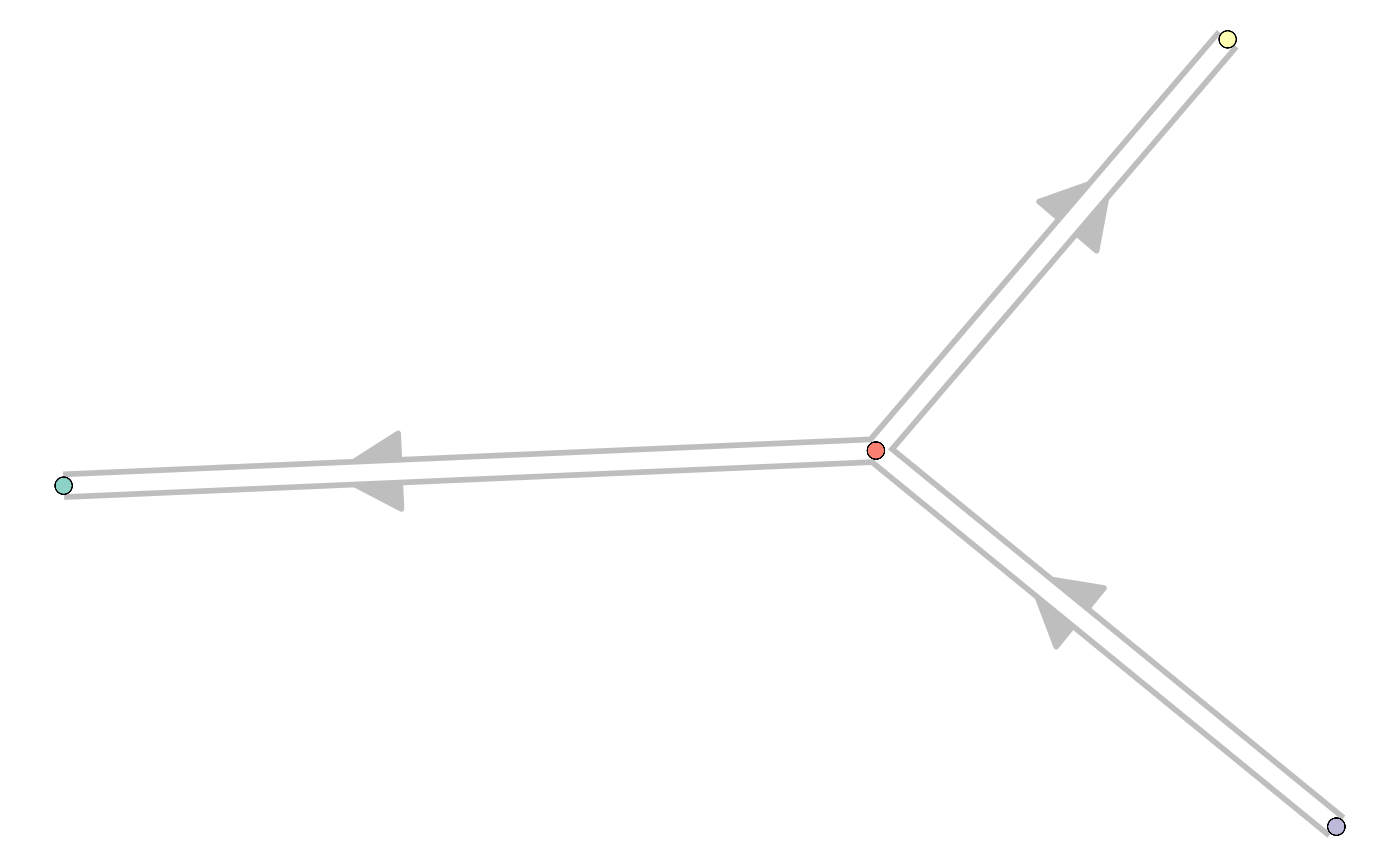
library(tibble) dataset <- wrap_data(cell_ids = letters) milestone_network <- tibble::tibble( from = c("A", "B", "B"), to = c("B", "C", "D"), directed = TRUE, length = 1 ) milestone_network#> # A tibble: 3 x 4 #> from to directed length #> <chr> <chr> <lgl> <dbl> #> 1 A B TRUE 1 #> 2 B C TRUE 1 #> 3 B D TRUE 1#> [1] "B" "D" "B" "A" "A" "B" "A" "D" "C" "B" "A" "C" "D" "A" "A" "D" "A" "A" "D" "B" "B" "A" "B" "C" "C" "B"trajectory <- add_cluster_graph(dataset, milestone_network, grouping) # for plotting the result, install dynplot dynplot::plot_graph(trajectory)#> Coloring by milestone#> Using milestone_percentages from trajectory