> Reference > > dynwrap :: Creating a trajectory > Constructs a trajectory using a graph between cells, by mapping cells onto a set of backbone cells.
Constructs a trajectory using a graph between cells, by mapping cells onto a set of backbone cells.
Source:
R/wrap_add_cell_graph.R
add_cell_graph.RdThis function will generate the milestone_network and progressions.
add_cell_graph(dataset, cell_graph, to_keep,
  milestone_prefix = "milestone_", ...)
Arguments
| dataset | A dataset created by |
|---|---|
| cell_graph | The edges between cells. Format: Data frame(from = character, to = character, length(optional) = numeric, directed(optional) = logical) |
| to_keep | A character vector with the identifiers of the backbone cells. Alternatively, a named boolean vector whether a cell is from the backbone |
| milestone_prefix | A prefix to add to the id of the cell ids when they are used as milestones, in order to avoid any naming conflicts, |
| ... | extra information to be stored in the wrapper. |
Value
The trajectory
Examples
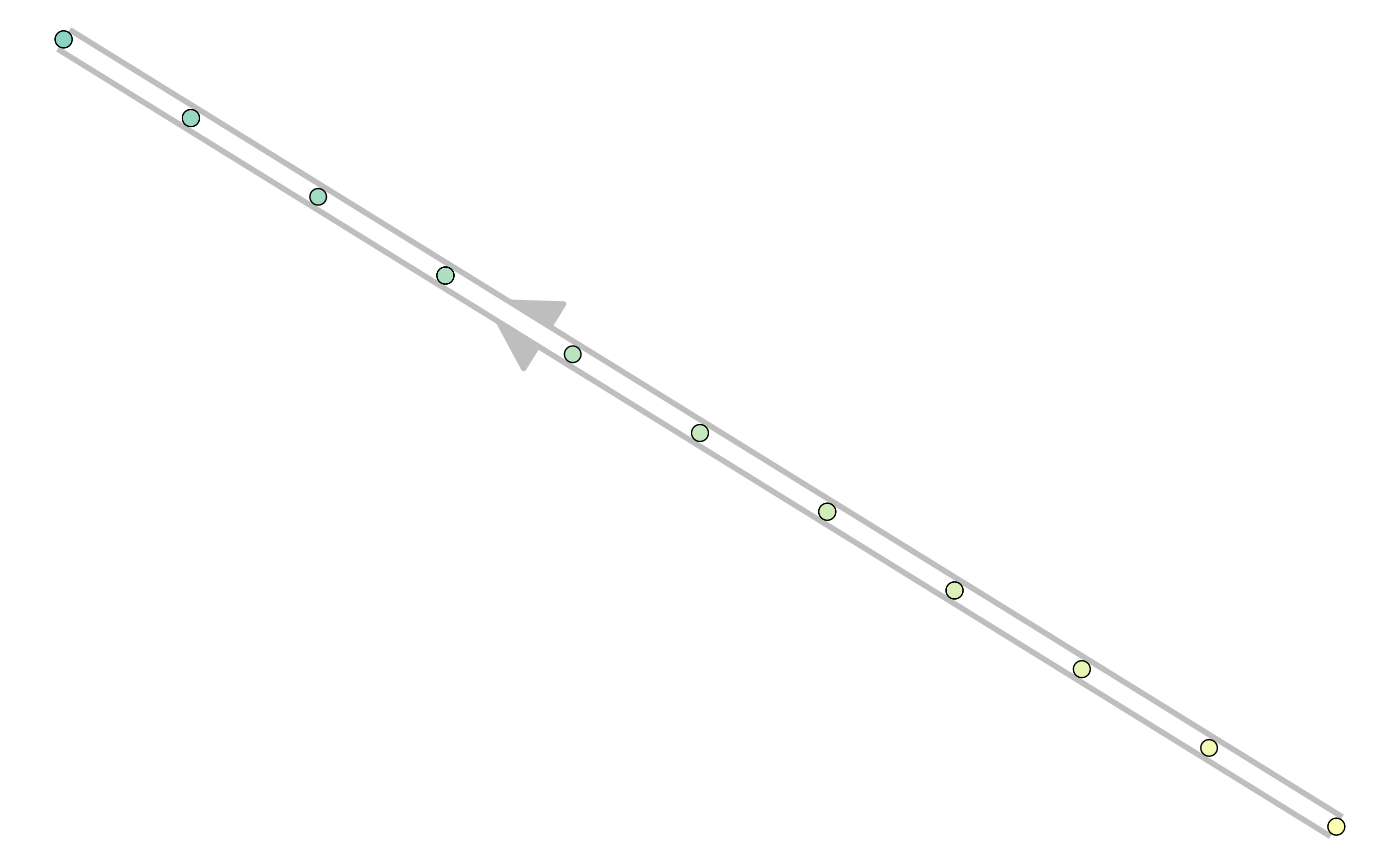
library(tibble)
library(dplyr)
dataset <- wrap_data(cell_ids = letters)

backbone_cell_graph <- tibble(
  from = letters[1:10],
  to = letters[2:11],
  length = 1,
  directed = TRUE
)
leaves_cell_graph <- tibble(
  from = letters[12:26],
  to = sample(letters[1:11], 15, replace = TRUE),
  length = 1,
  directed = TRUE
)
cell_graph <- bind_rows(backbone_cell_graph, leaves_cell_graph)
cell_graph#> # A tibble: 25 x 4
#>    from  to    length directed
#>    <chr> <chr>  <dbl> <lgl>
#>  1 a     b          1 TRUE
#>  2 b     c          1 TRUE
#>  3 c     d          1 TRUE
#>  4 d     e          1 TRUE
#>  5 e     f          1 TRUE
#>  6 f     g          1 TRUE
#>  7 g     h          1 TRUE
#>  8 h     i          1 TRUE
#>  9 i     j          1 TRUE
#> 10 j     k          1 TRUE
#> # … with 15 more rowsto_keep <- letters[1:11]
to_keep#>  [1] "a" "b" "c" "d" "e" "f" "g" "h" "i" "j" "k"trajectory <- add_cell_graph(dataset, cell_graph, to_keep)

# for plotting the result, install dynplot
dynplot::plot_graph(trajectory)#> Coloring by milestone#> Using milestone_percentages from trajectory