> Reference > > dynwrap :: Creating a trajectory > Create a trajectory given its branch network and the pseudotime of the cells on one of the branches
Create a trajectory given its branch network and the pseudotime of the cells on one of the branches
Source:
R/wrap_add_branch_trajectory.R
add_branch_trajectory.RdCreate a trajectory given its branch network and the pseudotime of the cells on one of the branches
add_branch_trajectory(dataset, branch_network, branches,
  branch_progressions, ...)
Arguments
| dataset | A dataset created by |
|---|---|
| branch_network | The network between branches Type: Data frame(from = charactor, to = character) |
| branches | The length and directedness of the branches Type: Data frame(branch_id = character, length = numeric, directed = logical) |
| branch_progressions | Specifies the progression of a cell along a transition in the branch network. Type: Data frame(cell_id = character, branch_id = character, percentage = numeric). |
| ... | extra information to be stored in the trajectory |
Value
The trajectory
Examples
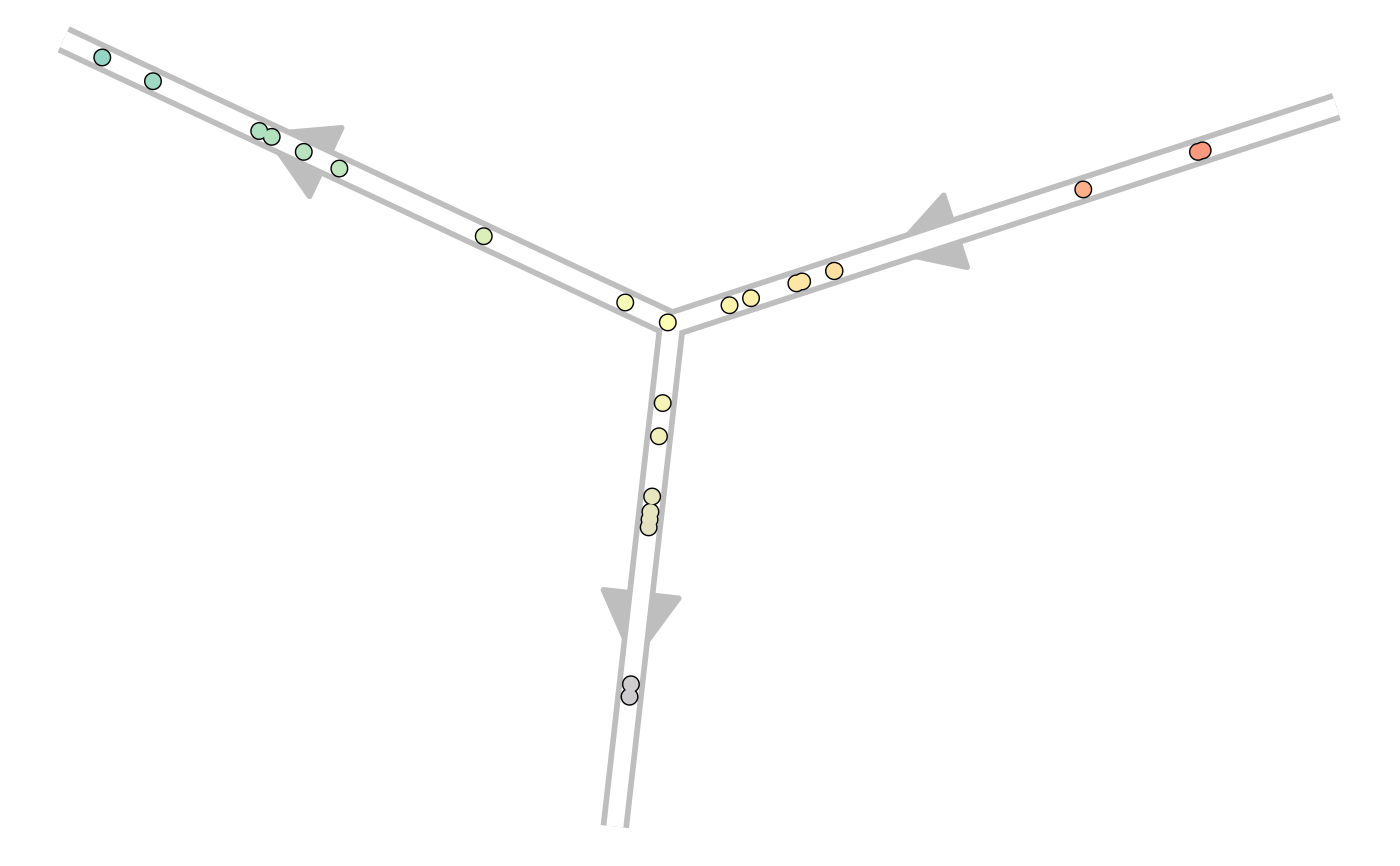
library(tibble) dataset <- wrap_data(cell_ids = letters) branch_network <- tibble(from = c("A", "A"), to = c("B", "C")) branch_network#> # A tibble: 2 x 2 #> from to #> <chr> <chr> #> 1 A B #> 2 A C#> # A tibble: 3 x 3 #> branch_id length directed #> <chr> <dbl> <lgl> #> 1 A 1 TRUE #> 2 B 1 TRUE #> 3 C 1 TRUEbranch_progressions <- tibble( cell_id = dataset$cell_ids, branch_id = sample(branches$branch_id, length(dataset$cell_ids), replace = TRUE), percentage = runif(length(dataset$cell_ids)) ) branch_progressions#> # A tibble: 26 x 3 #> cell_id branch_id percentage #> <chr> <chr> <dbl> #> 1 a B 0.0763 #> 2 b C 0.343 #> 3 c A 0.881 #> 4 d B 0.546 #> 5 e A 0.208 #> 6 f A 0.812 #> 7 g B 0.605 #> 8 h C 0.741 #> 9 i A 0.755 #> 10 j C 0.389 #> # … with 16 more rowstrajectory <- add_branch_trajectory( dataset, branch_network, branches, branch_progressions ) # for plotting the result, install dynplot dynplot::plot_graph(trajectory)#> Coloring by milestone#> Using milestone_percentages from trajectory