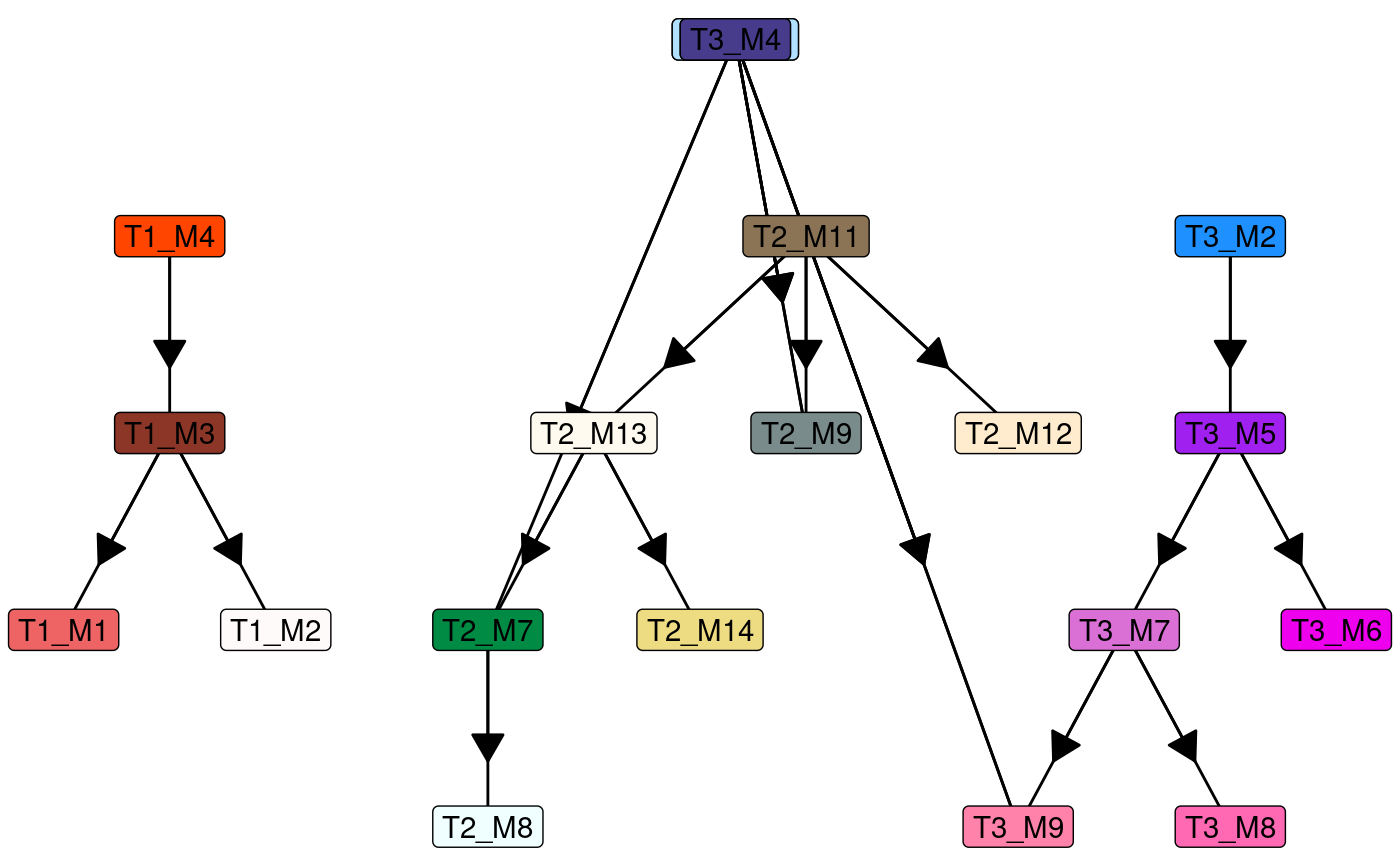
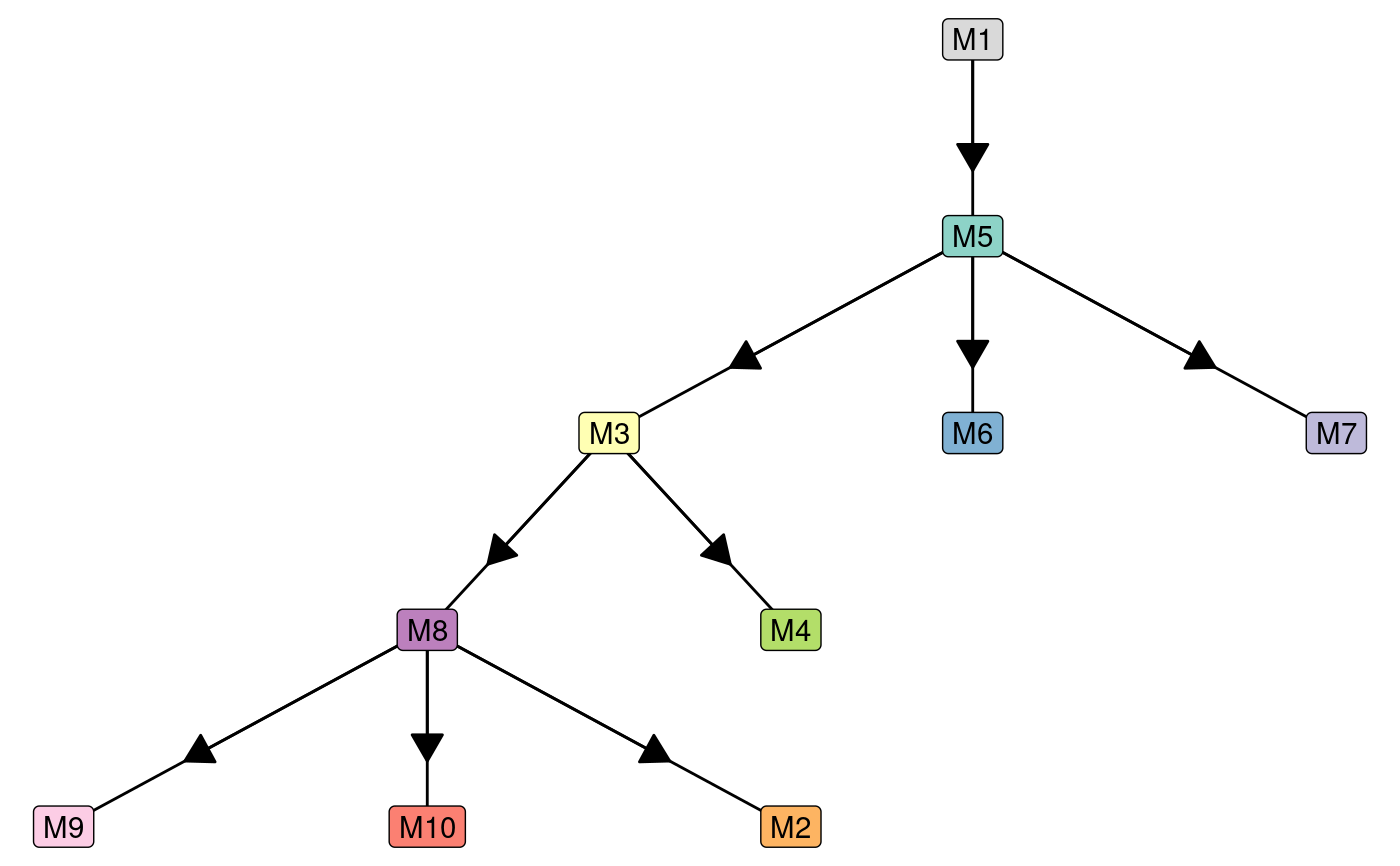
Plot the topology of a trajectory
plot_topology.RdPlot the topology of a trajectory
plot_topology(trajectory, color_milestones = c("auto", "given",
  "cubeHelix", "Set3", "rainbow"), milestones = NULL, layout = NULL)
Arguments
| trajectory | The trajectory |
|---|---|
| color_milestones | How to color the cells |
| milestones | Tibble containing the `milestone_id` and a `color` for each milestone |
| layout | The type of layout to create. |
Examples
#> root cell or milestone not provided, trying first outgoing milestone_id#> Using 'T1_M4' as root#> root cell or milestone not provided, trying first outgoing milestone_id#> Using 'M1' as root