Plot a trajectory on dimensionality reduction
plot_dimred.RdPlot a trajectory on dimensionality reduction
plot_dimred(trajectory, color_cells = c("auto", "none", "grouping",
  "feature", "milestone", "pseudotime"),
  dimred = ifelse(dynwrap::is_wrapper_with_dimred(trajectory), NA,
  ifelse(length(trajectory$cell_ids) > 500, dimred_pca, dimred_mds)),
  plot_trajectory = dynwrap::is_wrapper_with_trajectory(trajectory) &&
  !plot_milestone_network, plot_milestone_network = FALSE,
  label_milestones = dynwrap::is_wrapper_with_milestone_labelling(trajectory),
  alpha_cells = 1, size_trajectory = 1, grouping = NULL,
  groups = NULL, feature_oi = NULL, color_milestones = c("auto",
  "given", "cubeHelix", "Set3", "rainbow"), milestones = NULL,
  milestone_percentages = NULL, pseudotime = NULL,
  expression_source = "expression", color_density = c("none",
  "grouping", "feature"), padding = 0.1, nbins = 1000, bw = 0.2,
  density_cutoff = 0.3, density_cutoff_label = density_cutoff/10,
  waypoints = dynwrap::select_waypoints(trajectory),
  trajectory_projection_sd = sum(trajectory$milestone_network$length) *
  0.05, color_trajectory = "none")
Arguments
| trajectory | The trajectory |
|---|---|
| color_cells | How to color the cells |
| dimred | The dimensionality reduction matrix (with cell_ids as rownames) or function which will run the dimensionality reduction |
| plot_trajectory | Whether to plot the projected trajectory on the dimensionality reduction |
| plot_milestone_network | Whether to plot the projected milestone network on the dimensionality reduction |
| label_milestones | How to label the milestones. Can be TRUE (in which case the labels within the trajectory will be used), "all" (in which case both given labels and milestone_ids will be used), a named character vector, or FALSE |
| alpha_cells | The alpha of the cells |
| size_trajectory | The size of the trajectory segments |
| grouping | The grouping of the cells |
| groups | Tibble containing information of the cell groups |
| feature_oi | feature to plot expression |
| color_milestones | How to color the cells |
| milestones | Tibble containing the `milestone_id` and a `color` for each milestone |
| milestone_percentages | The milestone percentages |
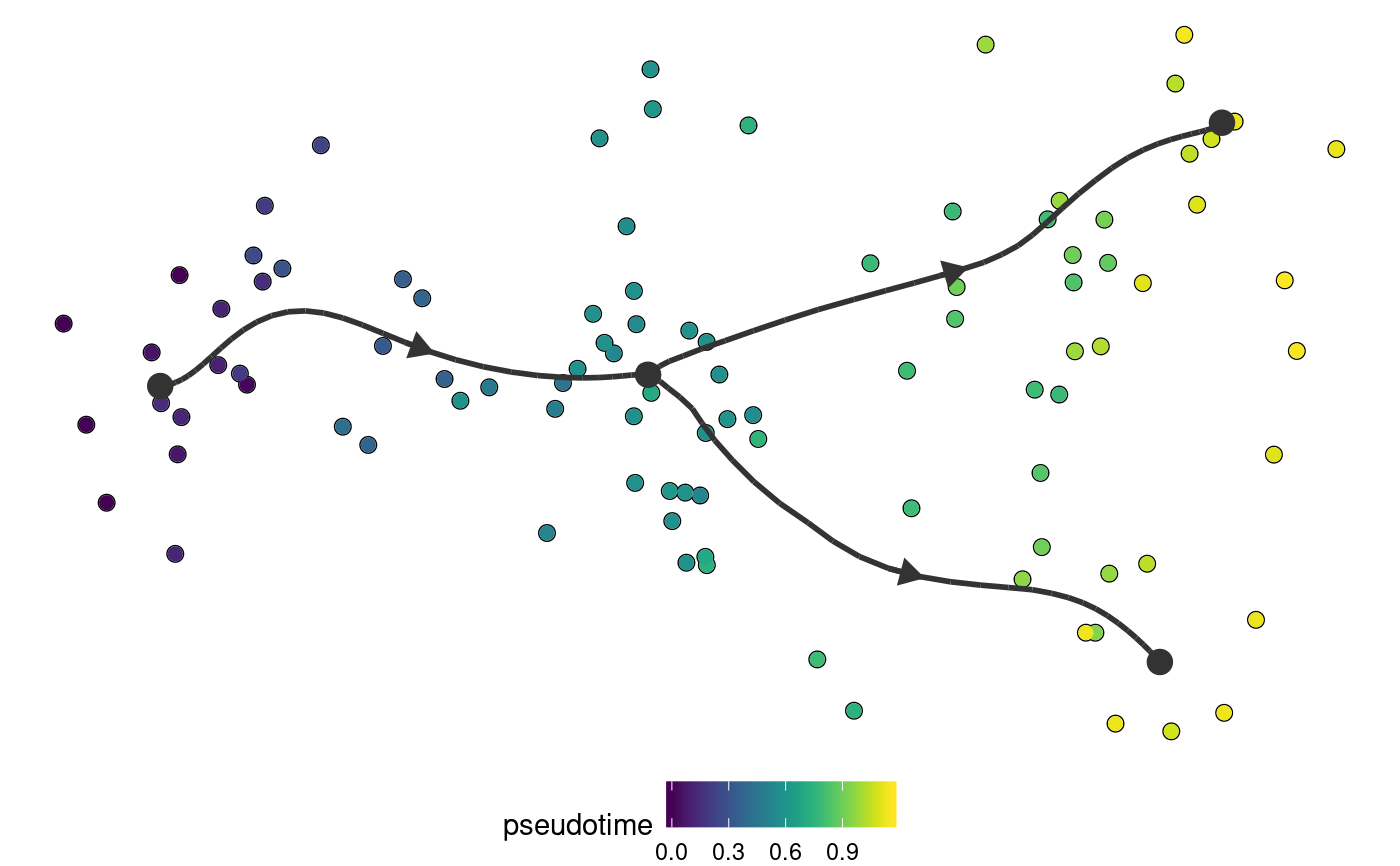
| pseudotime | The pseudotime |
| expression_source | Source of the expression |
| color_density | How to color density, can be "none", "grouping", or "feature" |
| padding | The padding in the edges to the plot, relative to the size of the plot |
| nbins | Number of bins for calculating the density |
| bw | Bandwidth, relative to the size of the plot |
| density_cutoff | Cutoff for density, the lower the larger the areas |
| density_cutoff_label | Cutoff for density for labelling, the lower the further way from cells |
| waypoints | The waypoints to use for projecting, as generated by [dynwrap::select_waypoints()] |
| trajectory_projection_sd | The standard deviation of the gaussian kernel to be used for projecting the trajectory. This is in the order of maginature as the lengths of the milestone_network. The lower, the more closely the trajectory will follow the cells |
| color_trajectory | How to color the trajectory, can be "nearest" for coloring to nearest cell, or "none" |
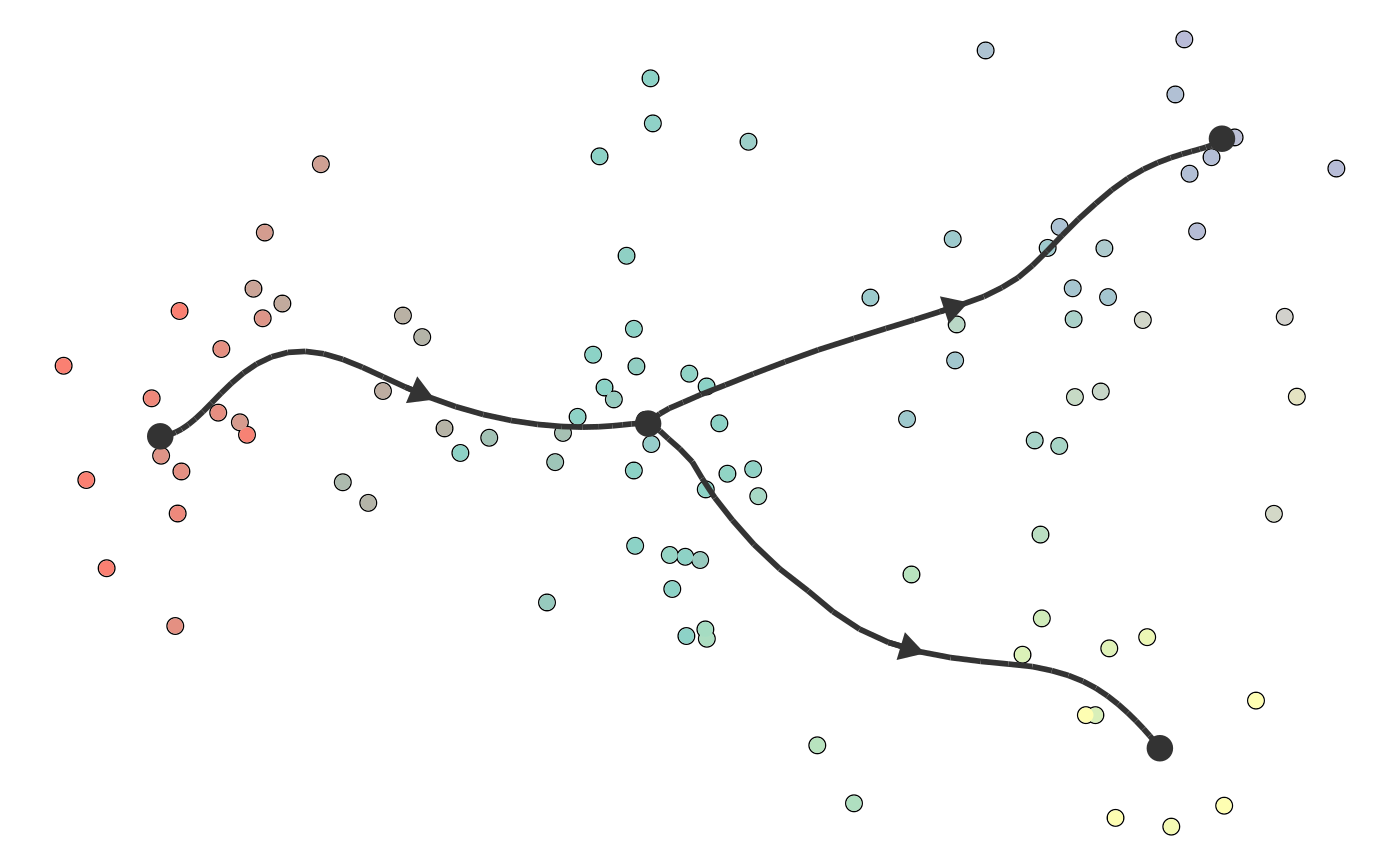
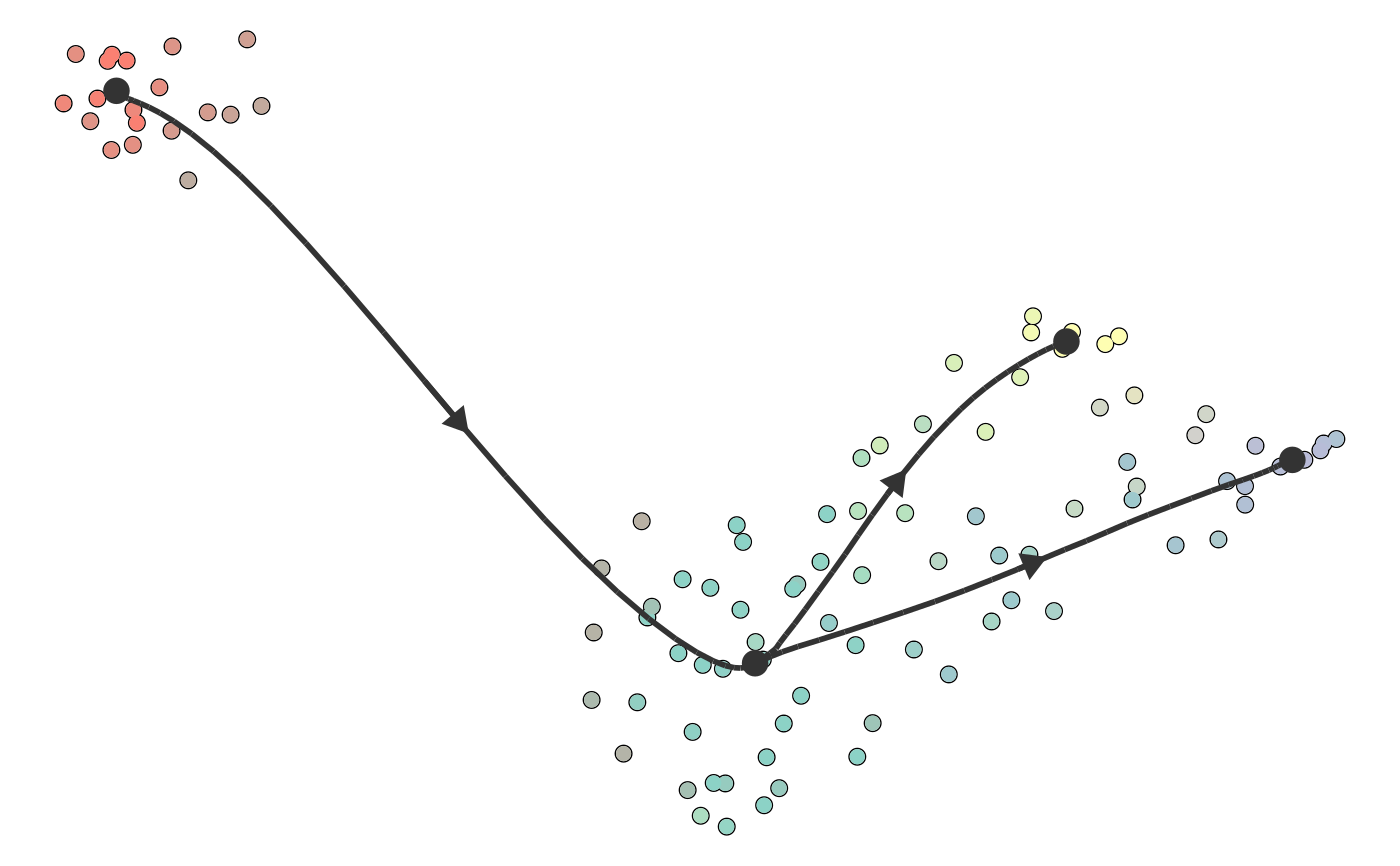
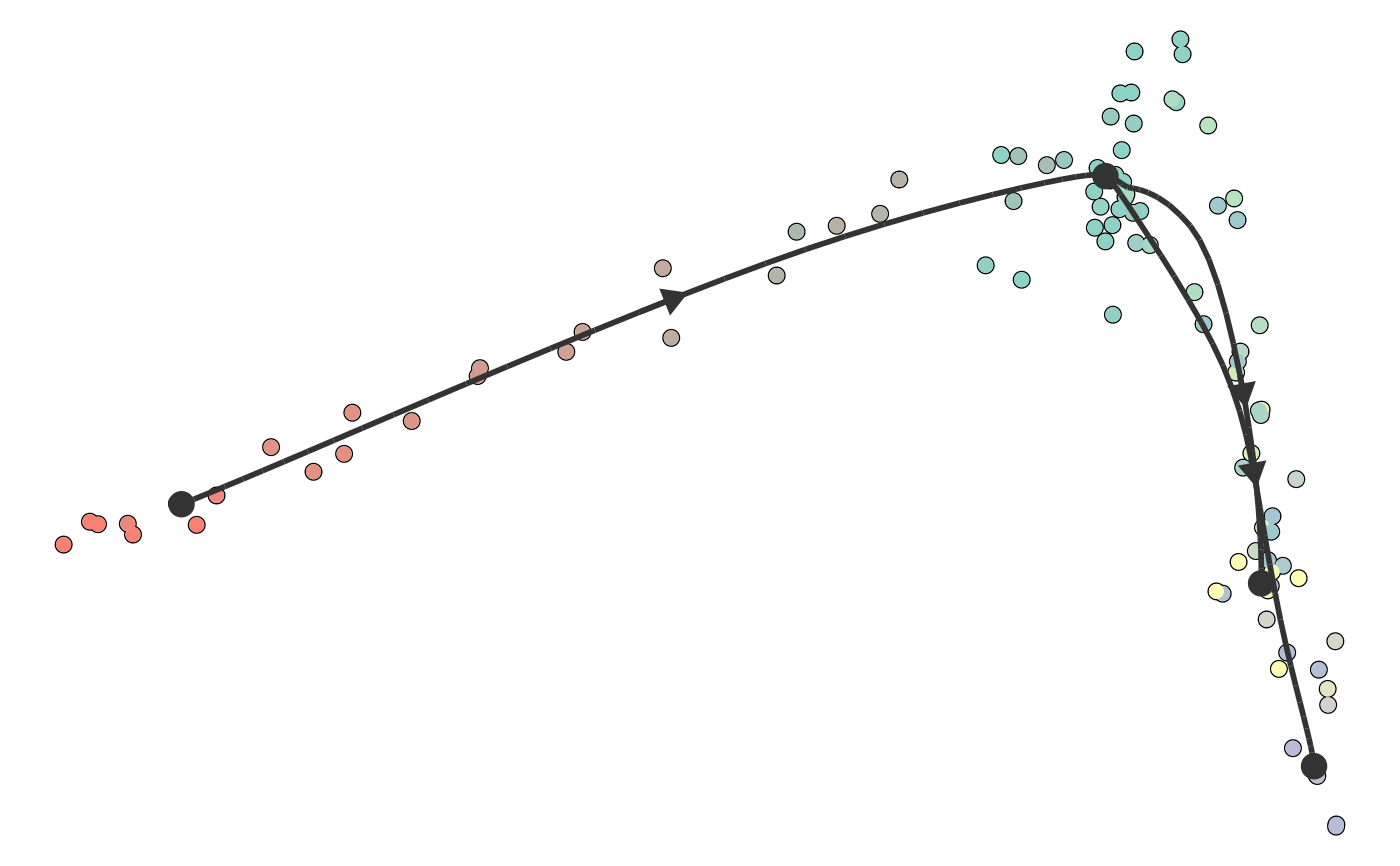
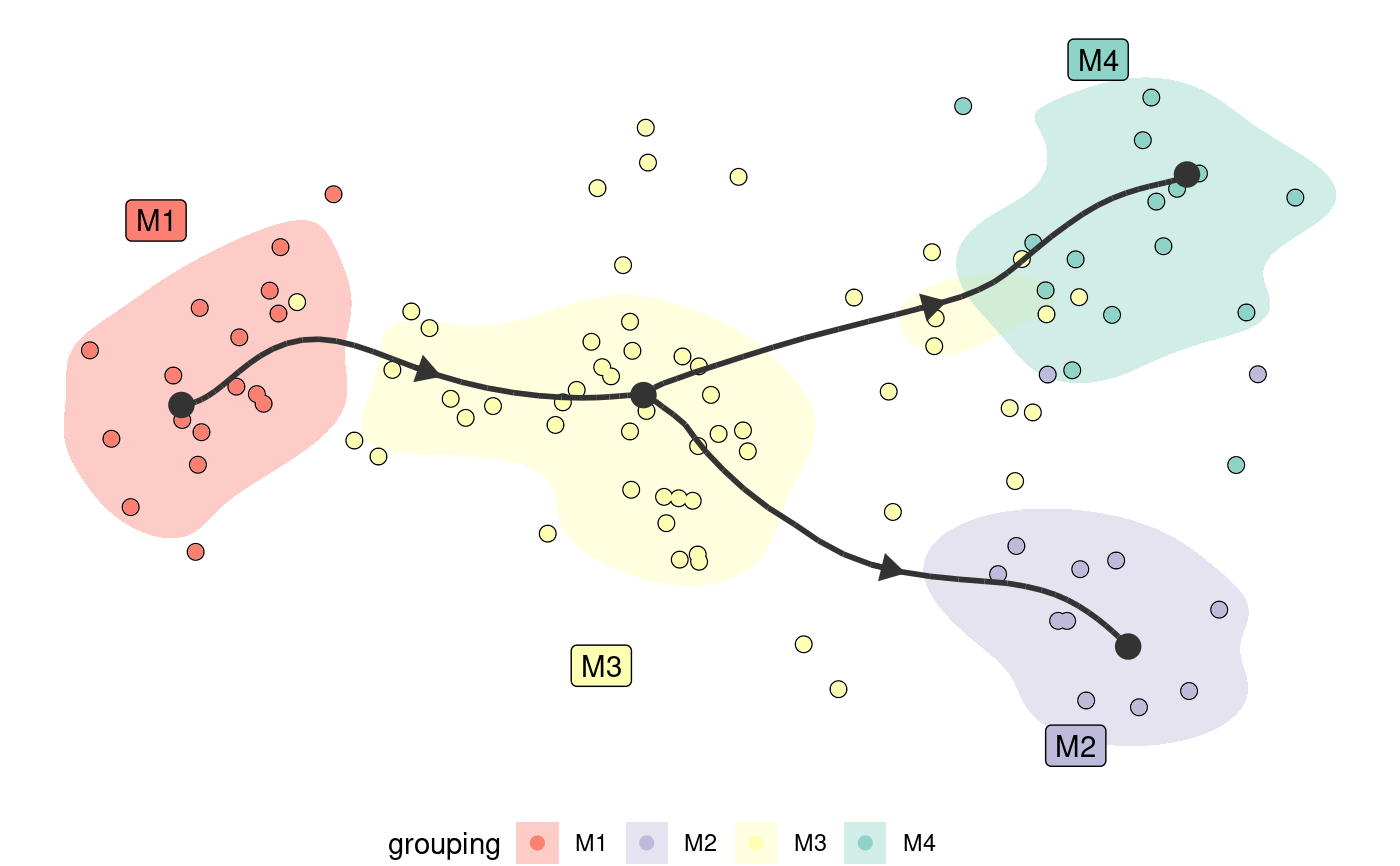
Examples
#>#>#>#>dimred <- dyndimred::dimred_dm_destiny(example_bifurcating$expression) plot_dimred(example_bifurcating, dimred = dimred)#>#>#>#>#>plot_dimred( example_bifurcating, color_density = "grouping", grouping = dynwrap::group_onto_nearest_milestones(example_bifurcating) )#>