> Reference > > dynwrap :: Creating a trajectory > Constructs a trajectory by projecting cells within a dimensionality reduction onto a backbone formed by a milestone network. Optionally, a cell grouping can be given which will restrict the edges on which a cell can be projected.
Constructs a trajectory by projecting cells within a dimensionality reduction onto a backbone formed by a milestone network. Optionally, a cell grouping can be given which will restrict the edges on which a cell can be projected.
Source:
R/wrap_add_dimred_projection.R
add_dimred_projection.RdThis function will generate the milestone_network and progressions.
add_dimred_projection(dataset, milestone_ids = NULL, milestone_network,
  dimred, dimred_milestones, grouping = NULL, ...)
Arguments
| dataset | A dataset created by |
|---|---|
| milestone_ids | The ids of the milestones in the trajectory. Type: Character vector. |
| milestone_network | The network of the milestones. Type: Data frame(from = character, to = character, length = numeric, directed = logical). |
| dimred | The dimensionality reduction matrix (with cell_ids as rownames) or function which will run the dimensionality reduction |
| dimred_milestones | An optional dimensionality reduction of the milestones. |
| grouping | A grouping of the cells, can be a named vector or a dataframe with group_id (character) and cell_id (character) |
| ... | extra information to be stored in the wrapper. |
Value
The trajectory
Examples
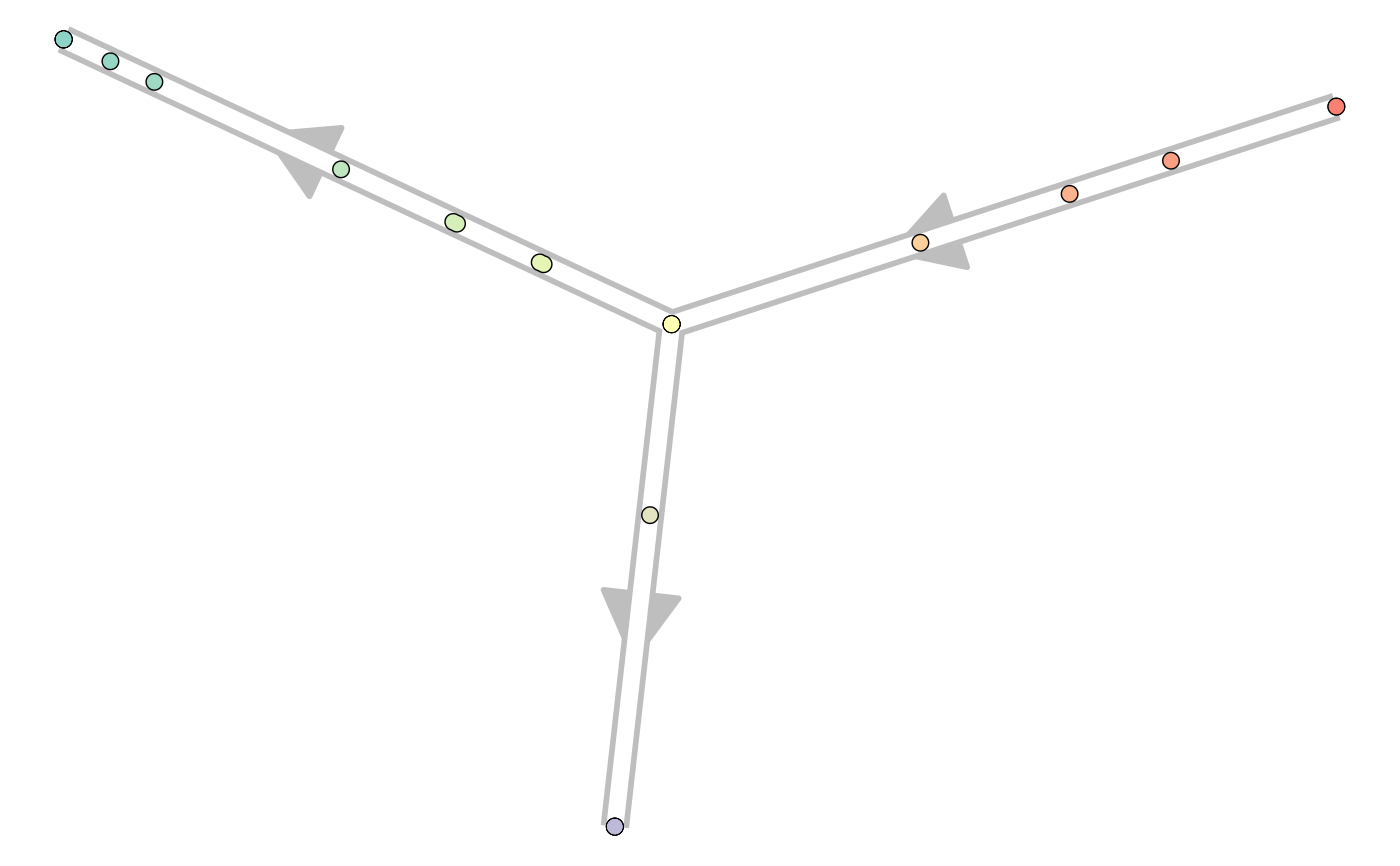
library(tibble)
dataset <- wrap_data(cell_ids = letters)

milestone_network <- tibble::tibble(
  from = c("A", "B", "B"),
  to = c("B", "C", "D"),
  directed = TRUE,
  length = 1
)
milestone_network#> # A tibble: 3 x 4
#>   from  to    directed length
#>   <chr> <chr> <lgl>     <dbl>
#> 1 A     B     TRUE          1
#> 2 B     C     TRUE          1
#> 3 B     D     TRUE          1dimred <- matrix(
  runif(length(dataset$cell_ids) * 2),
  ncol = 2,
  dimnames = list(dataset$cell_ids, c("comp_1", "comp_2"))
)
dimred#>        comp_1     comp_2
#> a 0.518923245 0.42044692
#> b 0.713531887 0.99517996
#> c 0.996785344 0.21668160
#> d 0.773217170 0.61393193
#> e 0.895180710 0.83893684
#> f 0.281728024 0.87118008
#> g 0.139223843 0.70638636
#> h 0.046410585 0.23338931
#> i 0.794306935 0.57336944
#> j 0.818950567 0.22262171
#> k 0.417419555 0.13321490
#> l 0.747896066 0.08980882
#> m 0.057266013 0.28946283
#> n 0.468984942 0.74871216
#> o 0.746089673 0.66533637
#> p 0.278019339 0.76867310
#> q 0.619681378 0.01043518
#> r 0.735949405 0.30812903
#> s 0.052957582 0.77245419
#> t 0.725099872 0.02302861
#> u 0.275327800 0.04770981
#> v 0.585088401 0.03544533
#> w 0.000633863 0.63871647
#> x 0.962298031 0.29273069
#> y 0.484792338 0.34948312
#> z 0.218368359 0.10571620dimred_milestones <- matrix(
  runif(2*4),
  ncol = 2,
  dimnames = list(c("A", "B", "C", "D"), c("comp_1", "comp_2"))
)
dimred_milestones#>      comp_1    comp_2
#> A 0.1502137 0.2729913
#> B 0.6010157 0.1193362
#> C 0.6299863 0.6635635
#> D 0.1103404 0.4535189trajectory <- add_dimred_projection(
  dataset,
  milestone_network = milestone_network,
  dimred = dimred,
  dimred_milestones = dimred_milestones
)

# for plotting the result, install dynplot
dynplot::plot_graph(trajectory)#> Coloring by milestone#> Using milestone_percentages from trajectory