Plot onedim
plot_onedim.RdPlot onedim
plot_onedim(trajectory, color_cells = c("auto", "none", "grouping",
  "feature", "milestone", "pseudotime"), grouping = NULL,
  groups = NULL, feature_oi = NULL, pseudotime = NULL,
  expression_source = "expression", color_milestones = c("auto",
  "given", "cubeHelix", "Set3", "rainbow"), milestones = NULL,
  milestone_percentages = NULL, orientation = 1, margin = 0.05,
  linearised = linearise_cells(trajectory, margin, one_edge = TRUE),
  quasirandom_width = 0.2, plot_cells = TRUE,
  label_milestones = dynwrap::is_wrapper_with_milestone_labelling(trajectory))
Arguments
| trajectory | The trajectory |
|---|---|
| color_cells | How to color the cells |
| grouping | The grouping of the cells |
| groups | Tibble containing information of the cell groups |
| feature_oi | feature to plot expression |
| pseudotime | The pseudotime |
| expression_source | Source of the feature expression, defaults to `expression` |
| color_milestones | How to color the cells |
| milestones | Tibble containing the `milestone_id` and a `color` for each milestone |
| milestone_percentages | The milestone percentages |
| orientation | Whether to plot the connections in the top (1) or bottom (-1) |
| margin | The margin to add |
| linearised | The linearised milestone network and progressions |
| quasirandom_width | The width of the quasirandom cell spreading |
| plot_cells | Whether to plot the cells |
| label_milestones | How to label the milestones. Can be TRUE (in which case the labels within the trajectory will be used), "all" (in which case both given labels and milestone_ids will be used), a named character vector, or FALSE |
Examples
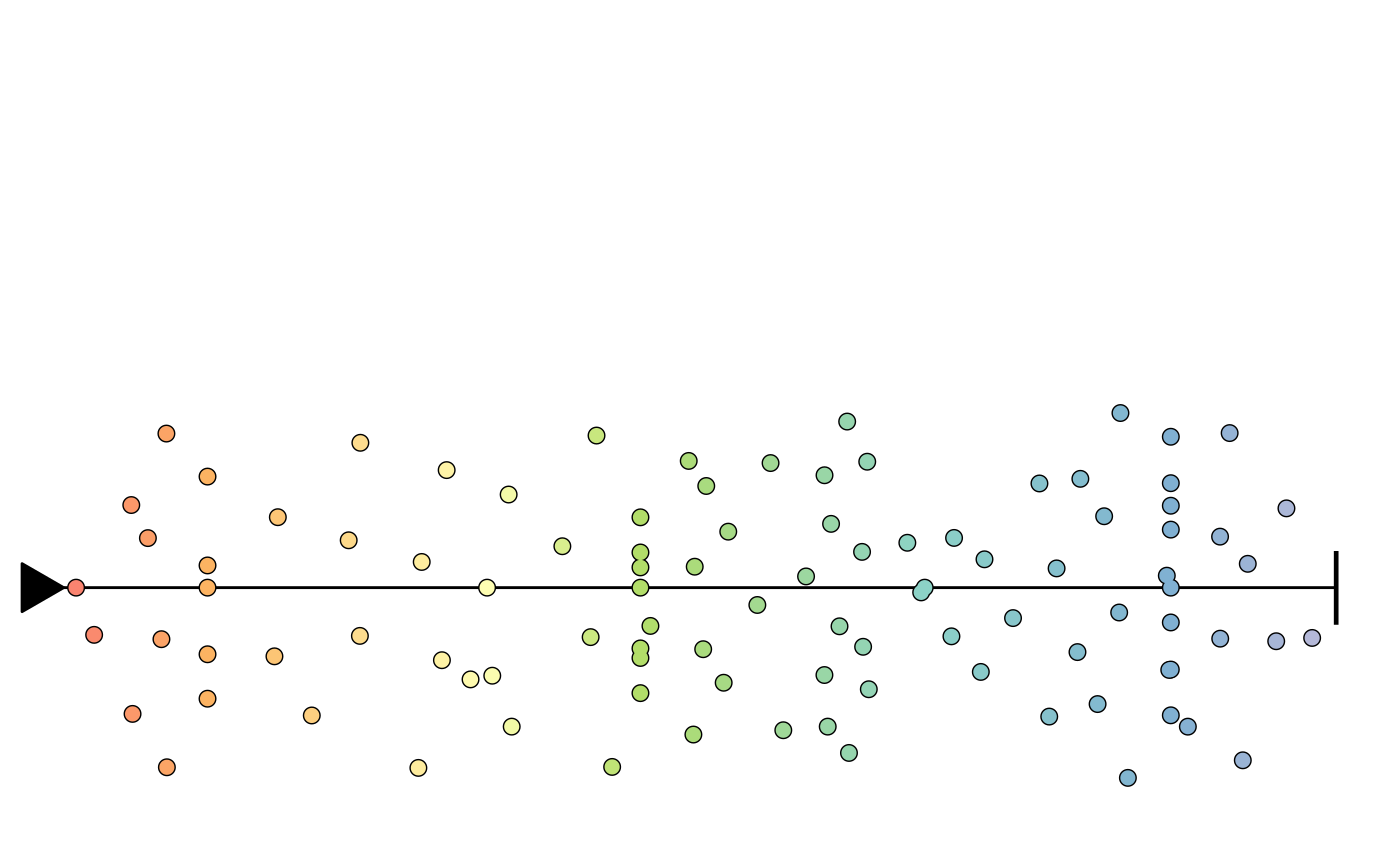
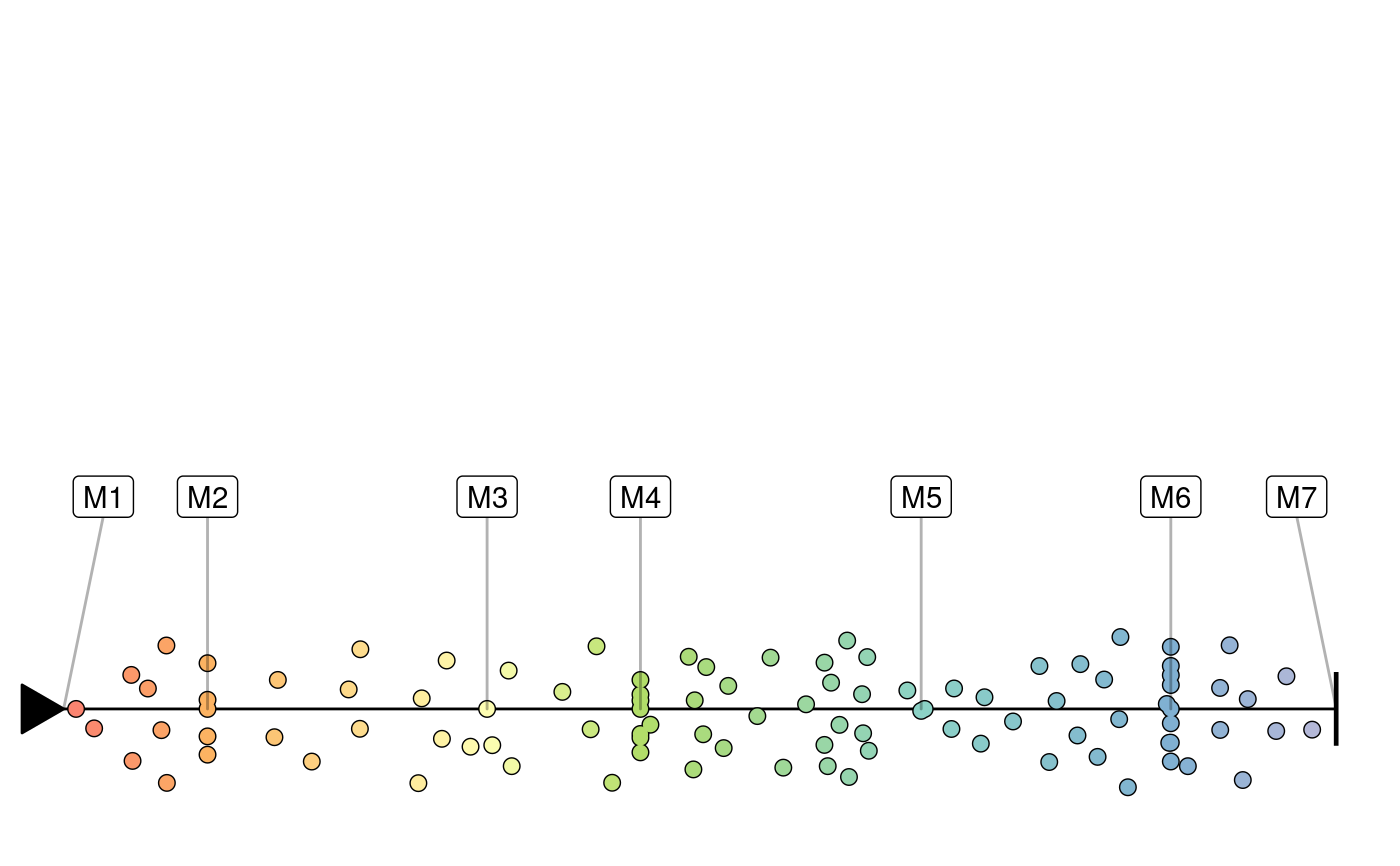
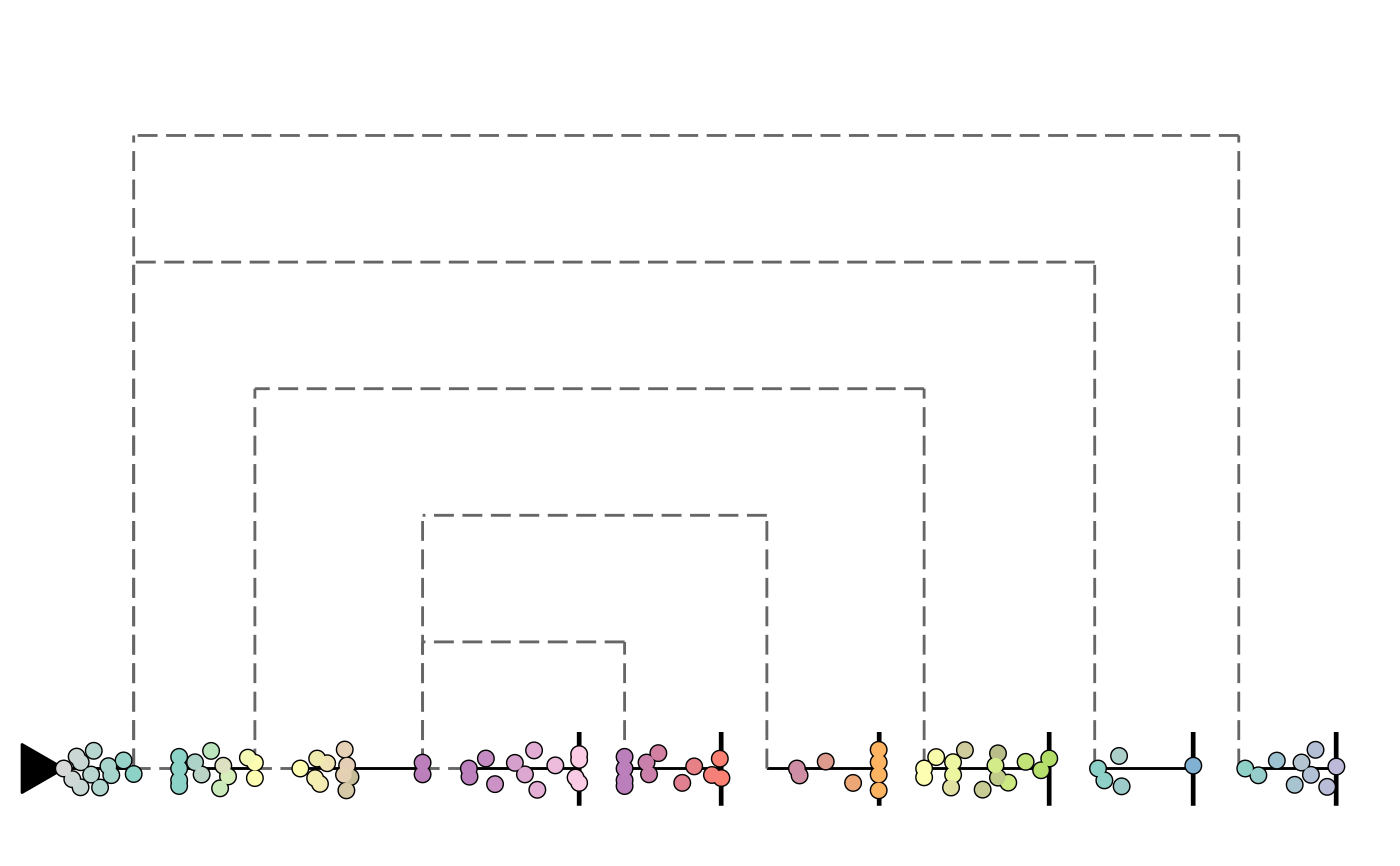
#> root cell or milestone not provided, trying first outgoing milestone_id#> Using 'M1' as root#> Coloring by milestone#> Using milestone_percentages from trajectory#> root cell or milestone not provided, trying first outgoing milestone_id#> Using 'M1' as root#> Coloring by milestone#> Using milestone_percentages from trajectory#> root cell or milestone not provided, trying first outgoing milestone_id#> Using 'M1' as root#> Coloring by milestone#> Using milestone_percentages from trajectory