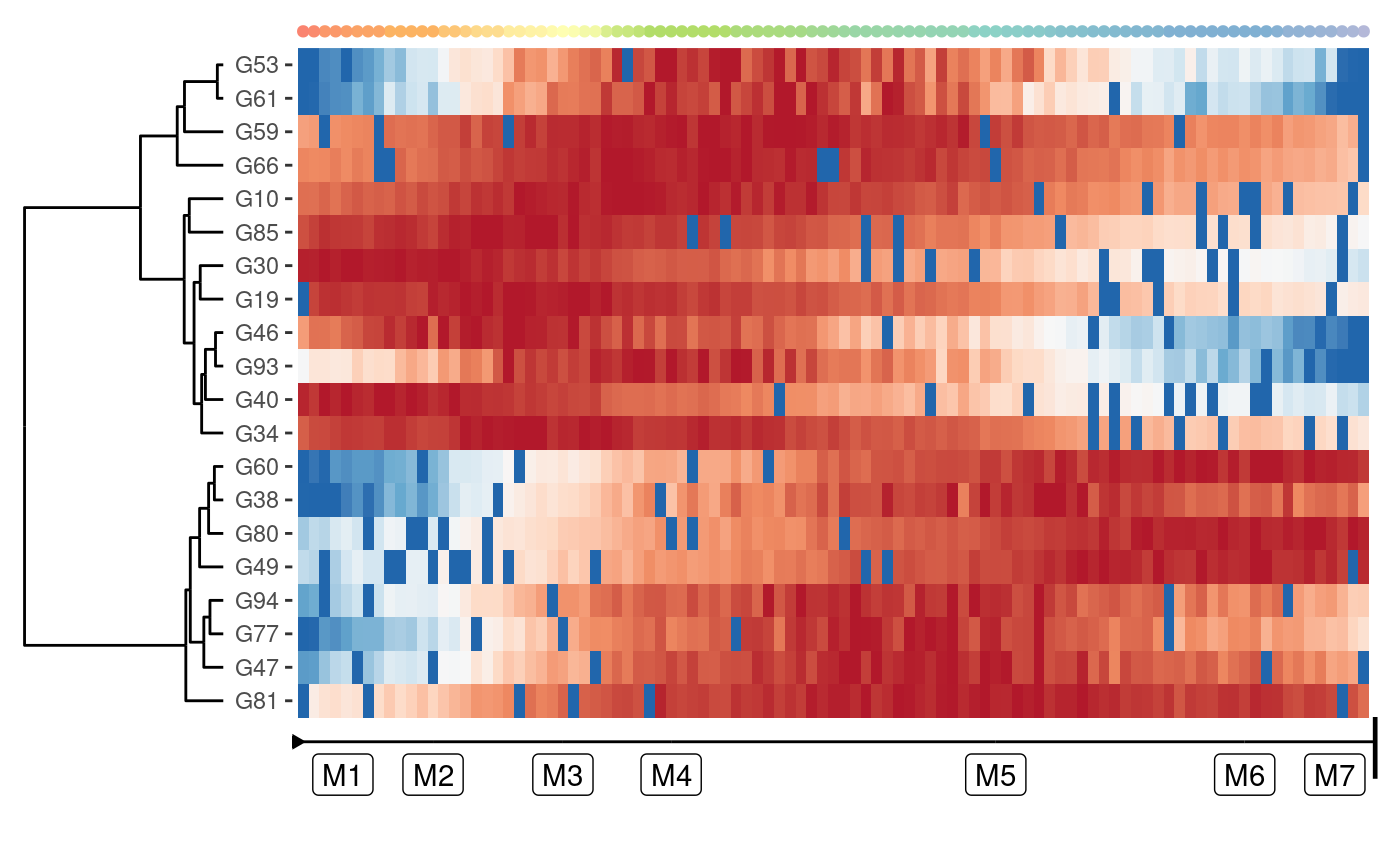
Plot the expression across a trajectory in a heatmap
plot_heatmap.RdWhen using RStudio: the heatmap will not show inside the plot area, but will be visible once you click the zoom button.
plot_heatmap(trajectory, expression_source = "expression",
  features_oi = 20, clust = "ward.D2", margin = 0.02,
  color_cells = NULL, milestones = NULL,
  milestone_percentages = trajectory$milestone_percentages,
  grouping = NULL, groups = NULL, cell_feature_importances = NULL,
  heatmap_type = c("tiled", "dotted"),
  scale = dynutils::scale_quantile, label_milestones = TRUE)
Arguments
| trajectory | The trajectory |
|---|---|
| expression_source | Source of the feature expression, defaults to `expression` |
| features_oi | The features of interest, either the number of features or a vector giving the names of the different features |
| clust | The method to cluster the features, or a hclust object |
| margin | The margin to add |
| color_cells | How to color the cells |
| milestones | Tibble containing the `milestone_id` and a `color` for each milestone |
| milestone_percentages | The milestone percentages |
| grouping | The grouping of the cells |
| groups | Tibble containing information of the cell groups |
| cell_feature_importances | The importances of every feature in every cell, as returned by [dynfeature::calculate_cell_feature_importance()] |
| heatmap_type | The type of heatmap, either tiled or dotted |
| scale | Whether to rescale the expression, can be a function or boolean |
| label_milestones | How to label the milestones. Can be TRUE (in which case the labels within the trajectory will be used), "all" (in which case both given labels and milestone_ids will be used), a named character vector, or FALSE |
Examples
#> No features of interest provided, selecting the top 20 features automatically#> Using dynfeature for selecting the top 20 features#> Loading required namespace: dynfeature#> root cell or milestone not provided, trying first outgoing milestone_id#> Using 'M1' as root#> Coloring by milestone#> No features of interest provided, selecting the top 20 features automatically#> Using dynfeature for selecting the top 20 features#> root cell or milestone not provided, trying first outgoing milestone_id#> Using 'M1' as root#> Coloring by milestone