Plot a trajectory and cellular positions as a graph
plot_graph.RdPlot a trajectory and cellular positions as a graph
plot_graph(trajectory, color_cells = c("auto", "none", "grouping",
  "feature", "milestone", "pseudotime"), color_milestones = c("auto",
  "given", "cubeHelix", "Set3", "rainbow"), grouping = NULL,
  groups = NULL, feature_oi = NULL, pseudotime = NULL,
  expression_source = "expression", milestones = NULL,
  milestone_percentages = NULL, transition_size = 3,
  milestone_size = 5, arrow_length = grid::unit(1, "cm"),
  label_milestones = dynwrap::is_wrapper_with_milestone_labelling(trajectory),
  plot_milestones = FALSE, adjust_weights = FALSE)
Arguments
| trajectory | The trajectory as created by |
|---|---|
| color_cells | How to color the cells |
| color_milestones | How to color the cells |
| grouping | The grouping of the cells |
| groups | Tibble containing information of the cell groups |
| feature_oi | feature to plot expression |
| pseudotime | The pseudotime |
| expression_source | Source of the feature expression, defaults to `expression` |
| milestones | Tibble containing the `milestone_id` and a `color` for each milestone |
| milestone_percentages | The milestone percentages |
| transition_size | The size of the transition lines between milestones. |
| milestone_size | The size of milestones. |
| arrow_length | length of the arrow. |
| label_milestones | How to label the milestones. Can be TRUE (in which case the labels within the trajectory will be used), "all" (in which case both given labels and milestone_ids will be used), a named character vector, or FALSE |
| plot_milestones | Whether to plot the milestones. |
| adjust_weights | Whether or not to rescale the milestone network weights |
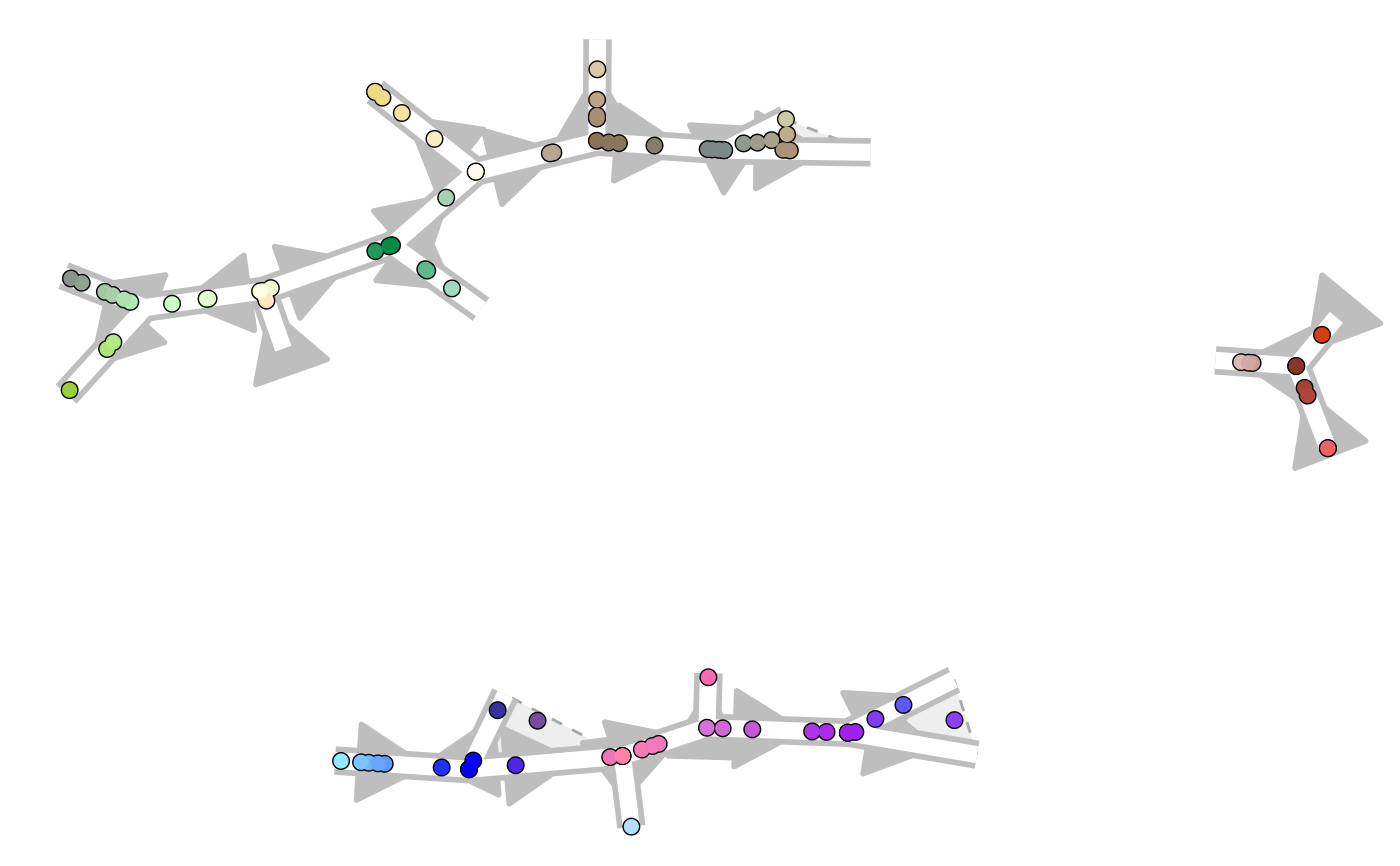
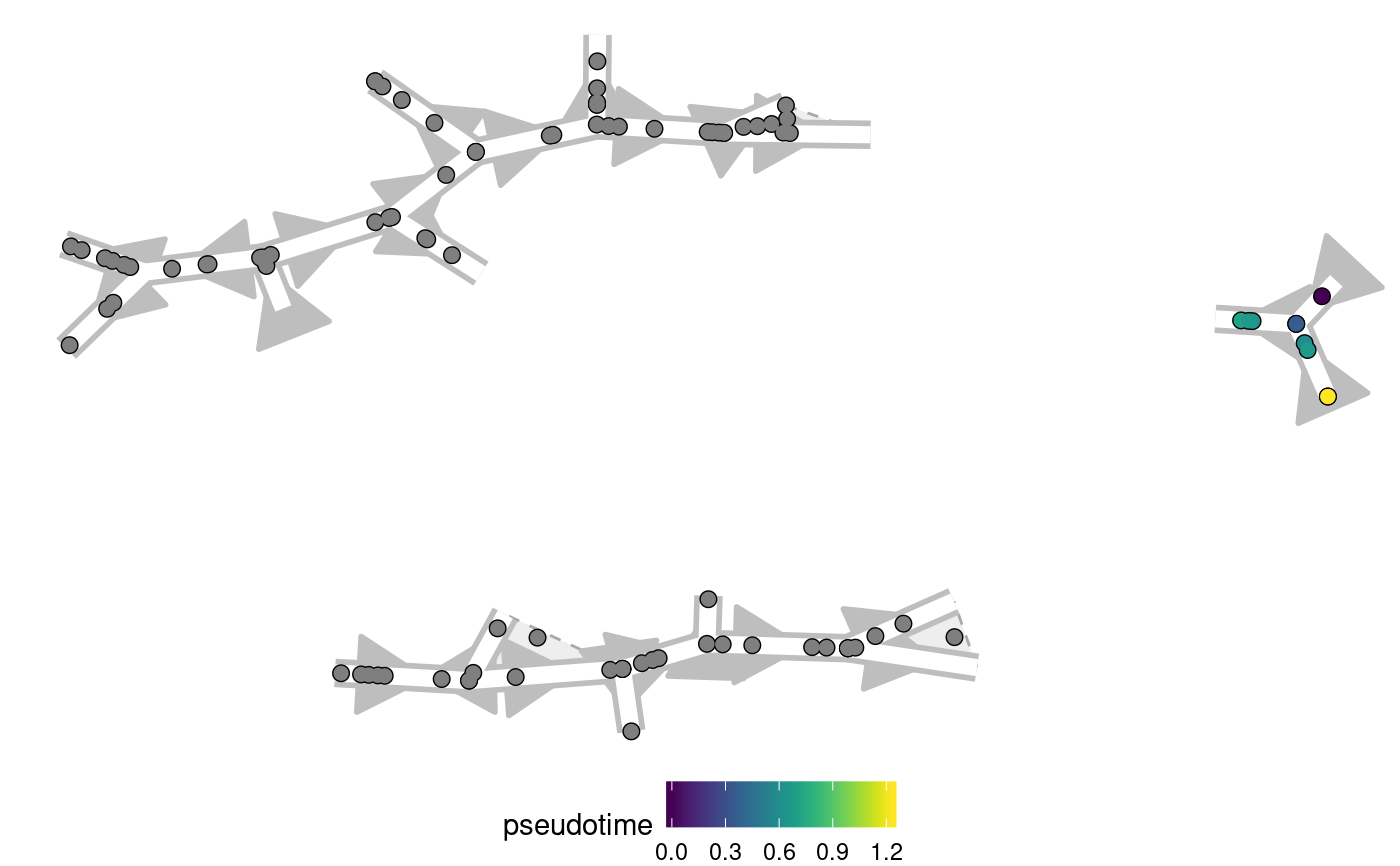
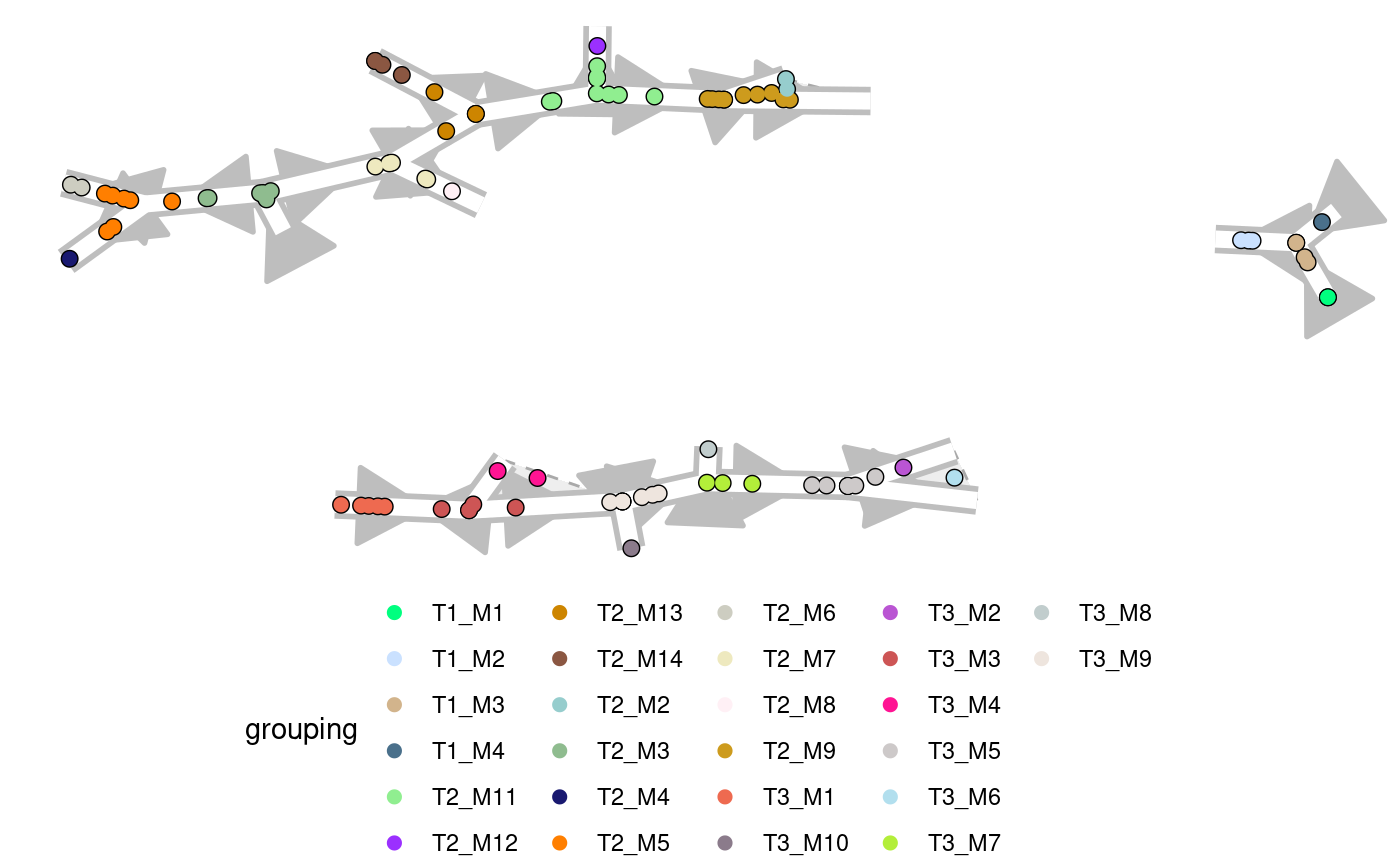
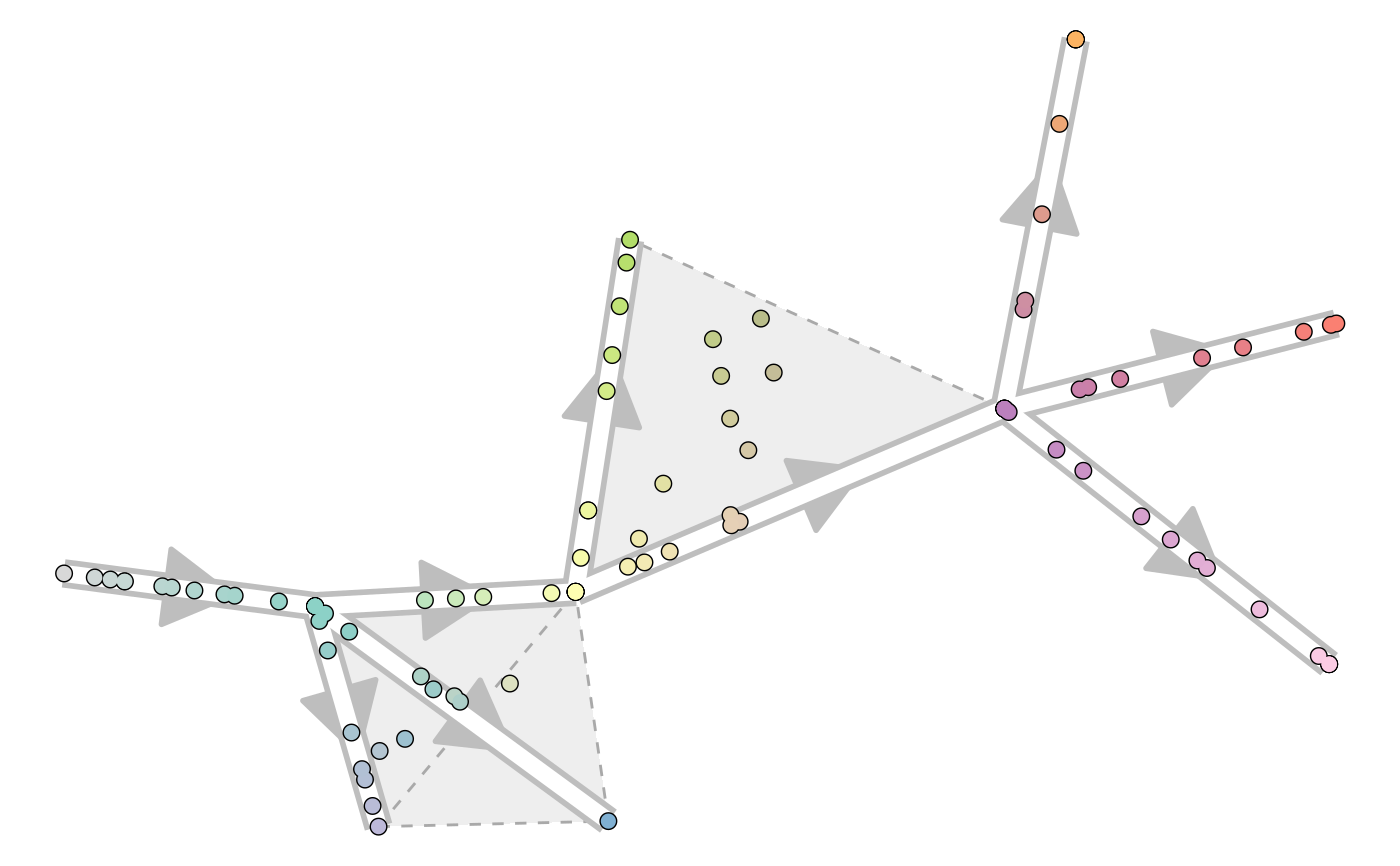
Examples
#> Coloring by milestone#> Using milestone_percentages from trajectory#> Pseudotime not provided, will calculate pseudotime from root milestone#> root cell or milestone not provided, trying first outgoing milestone_id#> Using 'T1_M4' as rootplot_graph( example_disconnected, color_cells = "grouping", grouping = dynwrap::group_onto_nearest_milestones(example_disconnected) )#> Coloring by milestone#> Using milestone_percentages from trajectory